
Information+ · @InfoPlusConf
189 followers · 21 posts · Server vis.social📢Deadline is approaching!
Apply to be a SV and get access to all the wonderful presentations, workshops, and exhibitions! #infovis #dataviz #datavis #conference
#conference #datavis #dataviz #infovis

arnicas · @arnicas
2313 followers · 1286 posts · Server mstdn.socialVictor Dibia’s automatic generation of datavis with Ai - he’s good, so it’s worth a shot (ui looks nice) https://github.com/microsoft/lida #infovis #datavis

Bharath M. Palavalli · @bmp
36 followers · 196 posts · Server mastodon.sdf.org
:-) Movie themes for your visualizations-> https://github.com/MatthewBJane/theme_park, know of any other such packages? cc: @djnavarro #rabbitholes #infovis #rstats

DatavizAdventure · @Datavizadventure
37 followers · 37 posts · Server vis.social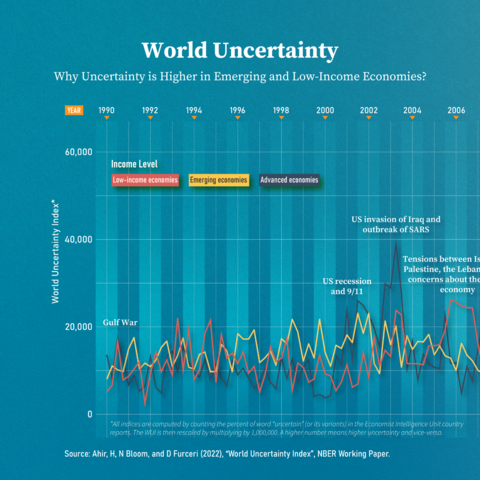
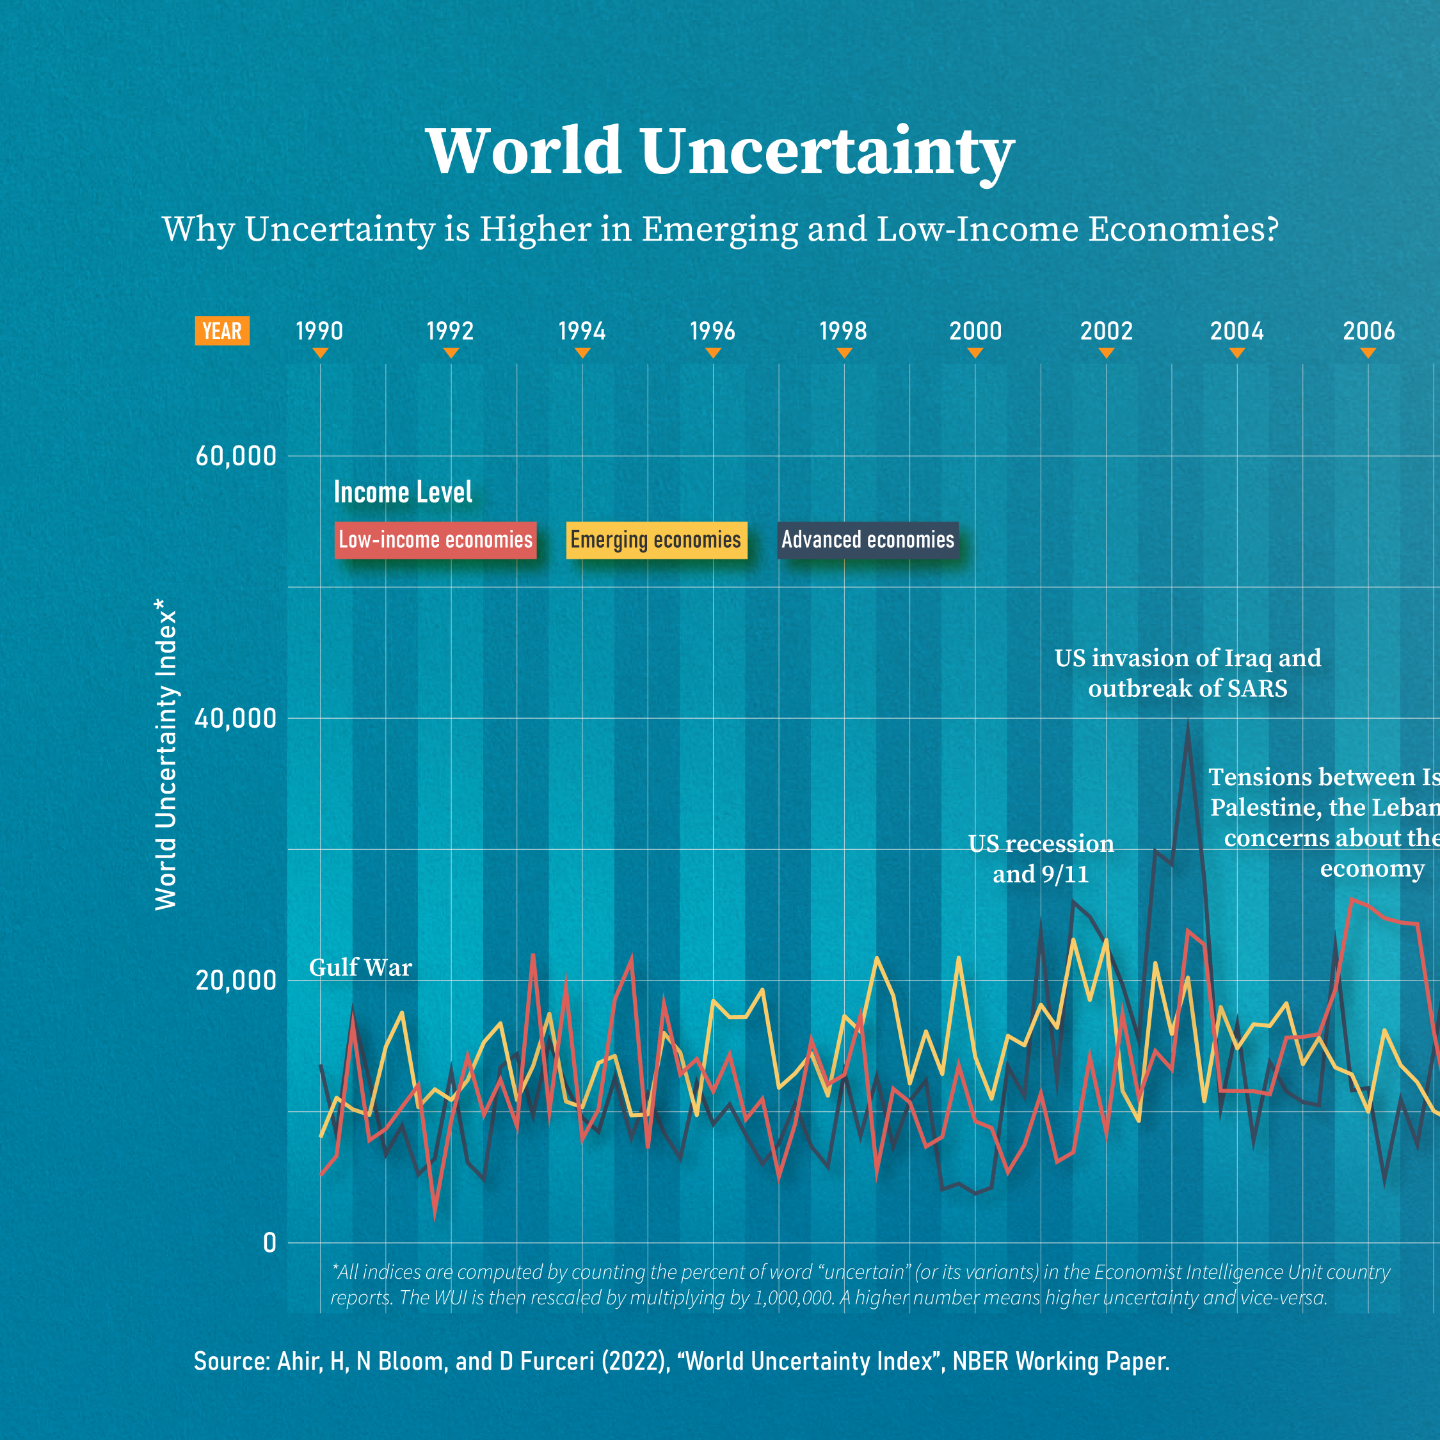
Uncertainty is a common feature in our daily lives, and it can affect us all regardless of where we live. The following dataviz shows that uncertainty is higher in emerging and low-income economies than in advanced economies.
.
.
.
.
.
.
.
#dataviz #datavisualization #informationdesign #data #infovis #datavizsociety #viz #uncertainty #worlduncertainty #design #informationisbeautiful #dataart #datajournalism #designer #datavizadventure #illustration
#illustration #datavizadventure #designer #datajournalism #dataart #informationisbeautiful #design #worlduncertainty #uncertainty #viz #datavizsociety #infovis #data #informationdesign #datavisualization #dataviz

Daniel Buschek · @DBuschek
371 followers · 123 posts · Server hci.social
Henrik Korsgaard · @heenrik
133 followers · 107 posts · Server hci.social
@DBuschek It's not a #infovis paper, but we did develop a small analysis tool for visualizing document revisions to try and identify collaborative patterns in our CSCW paper on "Territorial Functioning in Collaborative Writing". The visualizations are in section 4.2 https://link.springer.com/article/10.1007/s10606-019-09359-8
(and I don't know if the visualizations are useful, but they aided our analysis)
Daniel Buschek · @DBuschek
366 followers · 115 posts · Server hci.social
Daniel Buschek · @DBuschek
360 followers · 106 posts · Server hci.social#HCI / #CHI / #Infovis folks: What's one great #visualization to include in an initial set of examples to show in the first session of an infovis lecture? Can be recent, historic, academic, general media, etc.
#HCI #CHI #infovis #visualization
DatavizAdventure · @Datavizadventure
33 followers · 30 posts · Server vis.social
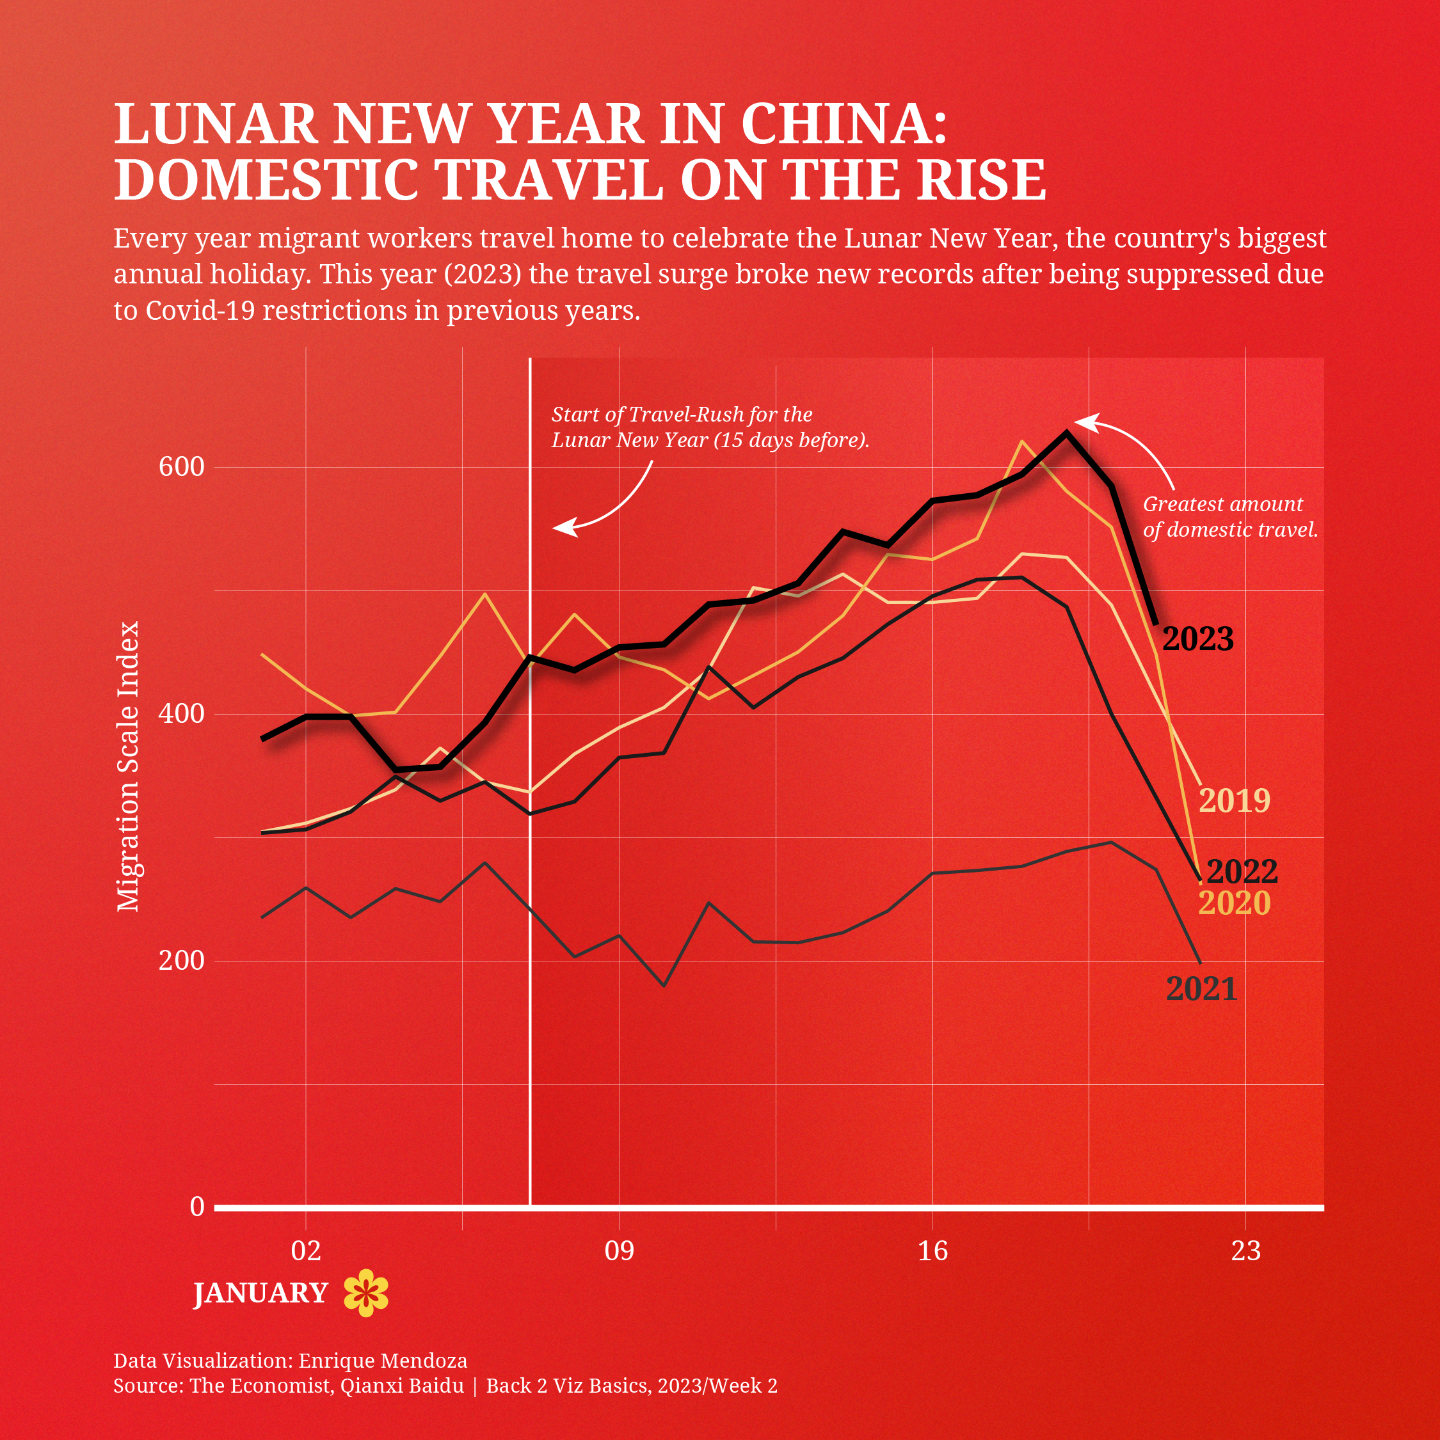
Hi! Here a new submission for the #B2VB challenge. "Lunar New Year in China: Domestic Travel on the Rise". Week 02, Build a Multiple Line Chart📈.
Ready for feedback 😊!
Tableau Link in my description.
https://public.tableau.com/app/profile/enrique.mendoza3617/viz/LunarNewYearinChina/Dashboard1
.
.
.
.
.
.
.
.
#dataviz #datavisualization #data #informationdesign #design #infovis #China #2023 #dataanalytics #datascience #chart #infographic #infographicdesign #B2VB #travels #lunarnewyear #datafam #work #domestictravel
#domestictravel #work #datafam #lunarnewyear #travels #infographicdesign #infographic #chart #datascience #dataanalytics #china #infovis #design #informationdesign #data #datavisualization #dataviz #b2vb

Gabriela Molina León · @gabymlp
51 followers · 7 posts · Server hci.social
Daniel Buschek · @DBuschek
355 followers · 94 posts · Server hci.socialI'm working on a new #infovis #lecture. What's one concept, algorithm, tool, paper or practical insight that I should definitely include? #HCI #visualization
#infovis #lecture #HCI #visualization

Mia · @mia
1253 followers · 805 posts · Server hcommons.socialI wrote a quick post on the animation packed full of different visualisations that @kallewesterling and I made for the @LivingWithMachines exhibition https://livingwithmachines.ac.uk/leeds-over-time-as-seen-through-a-data-science-lens/
#datascience #digitalhistory #infoviz #infovis #design

Hartmut Seichter · @retrakker
24 followers · 72 posts · Server mastodon.social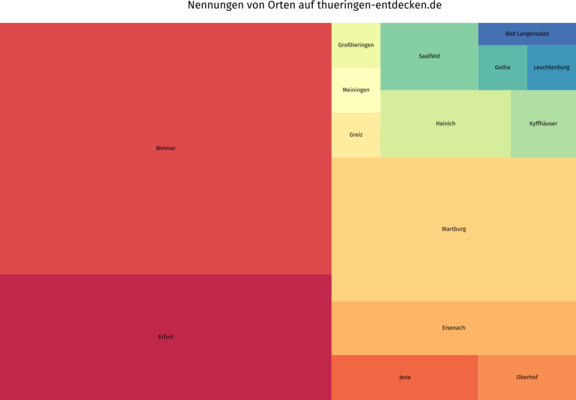
#thüringen hat eine offizielle Tourismus Website die das Land Reisenden nahebringen soll. Leider geht es dort nicht so breitgefächert zu wie man sich das hofft. #InfoVis

Ken-ichi · @kueda
86 followers · 83 posts · Server sfba.socialAnyone know of openings for a #javascript-focused frontend engineer? Particularly #game or #infovis related.

Sérgio Nunes · @ssn
20 followers · 7 posts · Server ciberlandia.ptBrilliant interactive piece on “trickle-up economics”.
Mia · @mia
1058 followers · 399 posts · Server hcommons.socialA glimpse of the future? Using AI chat to build helper tools like RTutor - Chat with your data via AI
http://rtutor.ai/
Via this twitter thread http://twitter.com/StevenXGe/status/1604861481526386690

brunoamaral · @brunoamaral
151 followers · 167 posts · Server mastodon.socialthis is one of the best things I've seen lately. A visual essay about the gender in the names of Porto's streets. https://ruasdogenero.pt/
quay · @quay
169 followers · 329 posts · Server mstdn.social#COYS, #Spurs, #Tottenham, #TottenhamHotspur
#Baltimore, #Bmore, #CharmCity
#MICA, #MarylandInstituteCollegeOfArt
#InfoViz, #InfoVis, #InformationVisualization
#RaciallyAmbiguous, #Cis, #Hetero, #Male
#Shoegaze #Spiritualized #stereolab #pavement #husband #father #balding #middleaged #BlackLivesMatter #male #hetero #cis #raciallyambiguous #informationvisualization #infovis #infoviz #marylandinstitutecollegeofart #mica #charmcity #bmore #baltimore #tottenhamhotspur #tottenham #Spurs #COYS #datavis #dataviz

Wolfgang Wopperer · @wowo101
81 followers · 59 posts · Server kolektiva.social
@gudrun_g Mit eine semihandgestrickten Lösung, die ich schon länger mal beschreiben wollte:
Die Notes sind einfache Markdown-Dokumente, mit [[WikiLink]]-Syntax verlinkt und gepflegt in Obsidian, das u.a. Backlinks unterstützt.
Via Obsidian Git packe ich die Notes in ein GitHub-Repository. Die regelmäßigen Commits fungieren gleichzeitig als Fortschrittskontrolle und liefern Daten über meine Produktivität.
Das Notes-Repo ist als Git-Submodule in ein zweites Repo eingelinkt, in dem ich meine Website pflege – ebenfalls auf Markdown-Basis, mit dem Static Page Generator Jekyll und gehostet via GitHub Pages. Jekyll generiert aus den Markdown-Notes die entsprechenden HTML-Seiten unter /notes/.
Aus dem "Digital Garden" Jekyll-Template von Maxime Vaillancourt verwende ich angepasst Plugins, die beim Seitengenerieren die Notes aufräumen, HTML-Verlinkungen generieren und JavaScript-Datenstrukturen erzeugen, die das ganze Note Network abbilden.
Aus diesen Strukturen generiere ich (mit JavaScript) auf den einzelnen Seiten automatisch Varianten der Netzwerk-Visualisierung (als SVGs). Dafür verwende das D3.js-Framework und die cola.js-Bibliothek.
Fürs Styling des Ganzen benutze ich Tailwind CSS.
Klingt aufwendig (und war es im Setup auch), ist im Alltag aber extrem effizient und friktionsarm.
Sehr technisch, aber vielleicht trotzdem hilfreich. 😬
Links:
Obsidian: https://obsidian.md/
Obsidian Git: https://github.com/denolehov/obsidian-git
Jekyll: https://jekyllrb.com/
GitHub Pages: https://pages.github.com/
Digital Garden Template: https://maximevaillancourt.com/blog/setting-up-your-own-digital-garden-with-jekyll
D3.js: https://d3js.org/
cola.js: https://ialab.it.monash.edu/webcola/
Tailwind CSS: https://tailwindcss.com/
#notetaking #digitalgarden #jekyll #infovis #javascript
DatavizAdventure · @Datavizadventure
15 followers · 7 posts · Server vis.social
Hello #datafam!
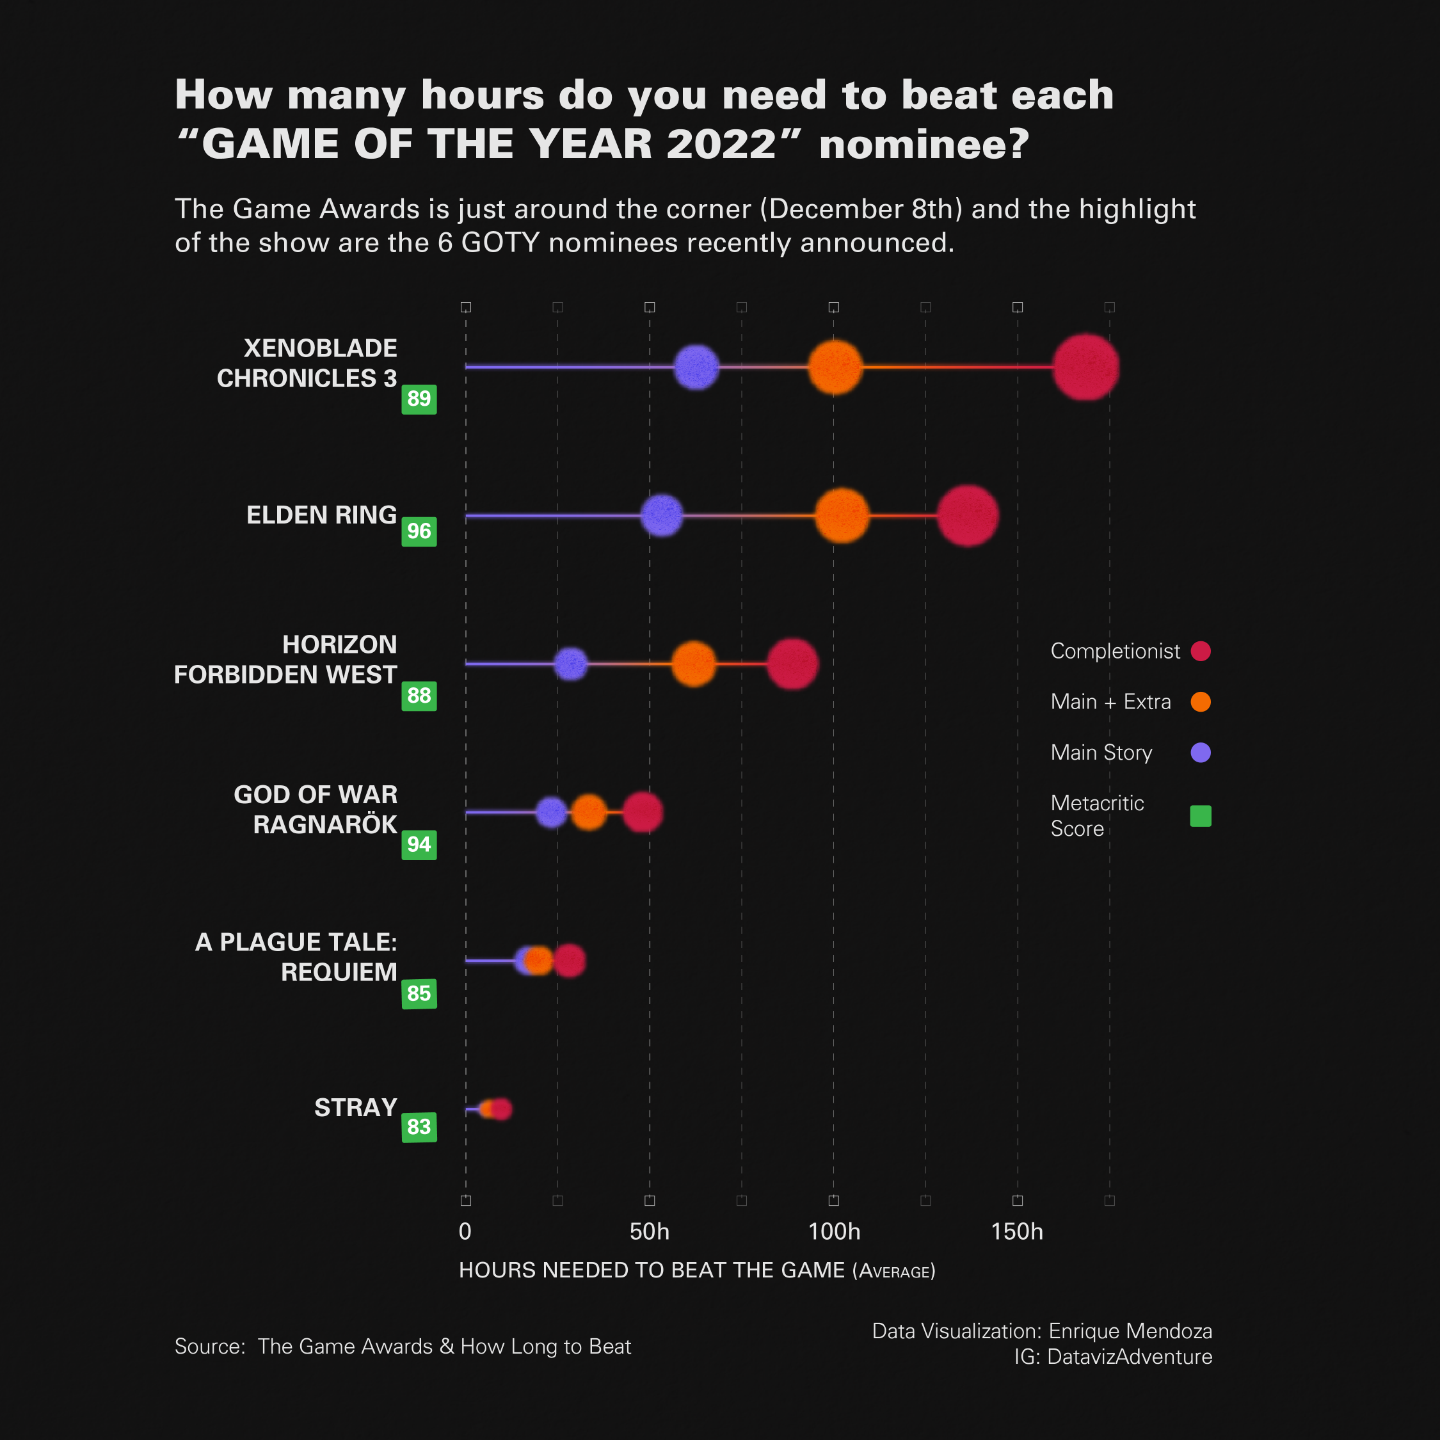
The 6 "Game of the Year" (#GOTY) nominees have been announced, so I highly recommend to play any of these nominees before The Game Awards night (December 8th). Here a #dataviz for help you know the hours needed to beat each game😊.
#datavisualization #videogames #gameawards #informationdesign #gamer #pc #infovis #datadesign #designer #ggplot2
#ggplot2 #designer #datadesign #infovis #pc #gamer #informationdesign #GameAwards #videogames #datavisualization #dataviz #goty #datafam