Jáchym Brzezina · @jachym
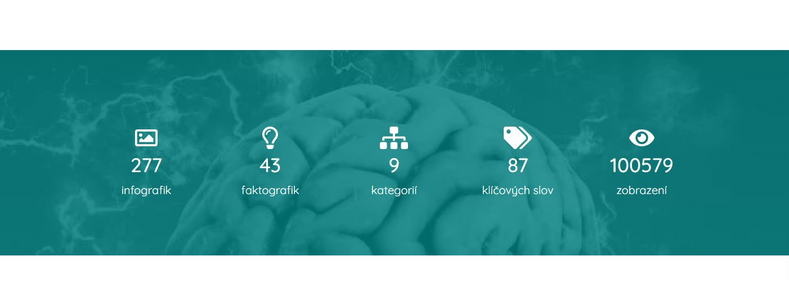
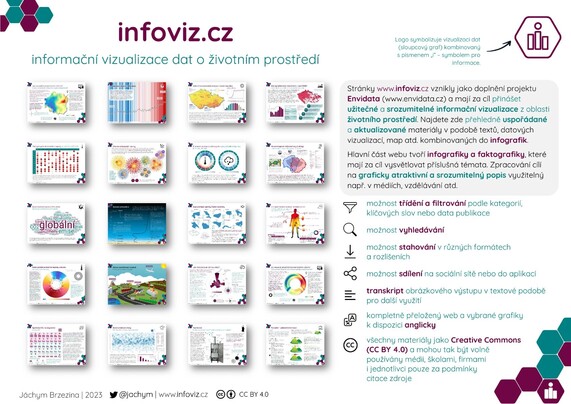
266 followers · 144 posts · Server mastodonczech.cz1/4 Počet zobrazení materiálů na projektu Infoviz dosáhl včera 100 000. Za rok a půl existence zde najdete více než 275 infografik, více než 40 faktografik, nově například zajímavý rozcestník. Pokud vás projekt zaujal, budu rád za sdílení.
#pocasi #klima #ovzdusi #voda #infoviz
Jáchym Brzezina · @jachym
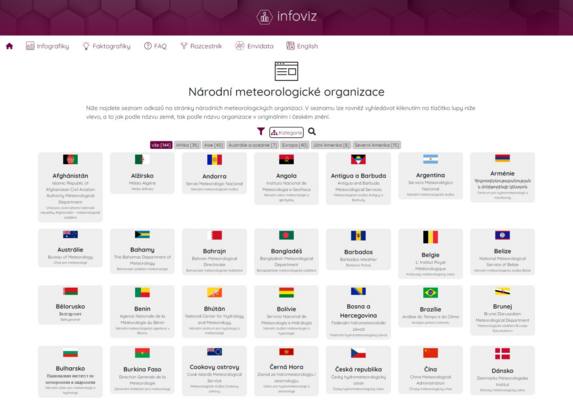
243 followers · 121 posts · Server mastodonczech.czNa stránkách #infoviz najdete novou sekci Rozcestník. Už teď zde najdete odkazy na téměř 150 národních meteorologických služeb. Některé velmi zajímavé! Nechybí funkce filtrování a hledání. Do budoucna chci rozšířit o zajímavé odkazy na webové stránky, profily lidí atd.
Cílem je vytvořit ucelený a užitečný rozcestník k informacím o počasí, klimatu, vodě, ovzduší a životním prostředí obecně.Tipy na položky v rozcestníku budu sbírat i od ostatních, včetně zde na Mastodonu.
Jáchym Brzezina · @jachym
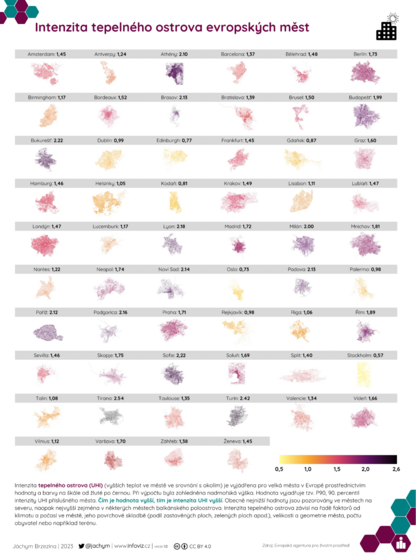
238 followers · 115 posts · Server mastodonczech.cz1/3 Intenzita tepelného ostrova v různých evropských městech. Nejméně se projevuje na severu, nejvíce v některých městech na Balkánském poloostrově, ale například také v Paříži nebo Turínu.
#teplota #klima #infoviz #tepelnyostrov #infografika
Onemoment · @onemoment
16 followers · 52 posts · Server mstdn.socialHave you tried @LabPlot? It's an easy-to-use, open-source, cross-platform curve fitting, data visualization and analysis (and much more) software.
It has a YouTube channel with short video tutorials.
https://www.youtube.com/@LabPlot/videos
Here is list of @LabPlot features:
https://labplot.kde.org/features/
#labplot #dataanalysis #CurveFitting #infoviz #dataviz
Onemoment · @onemoment
16 followers · 52 posts · Server mstdn.social@taosecurity @LabPlot It has a YouTube channel with short video tutorials.
Onemoment · @onemoment
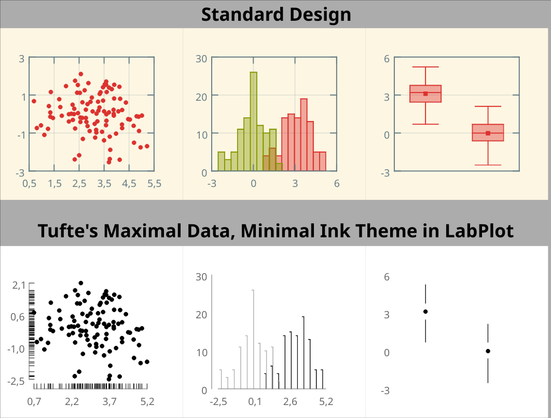
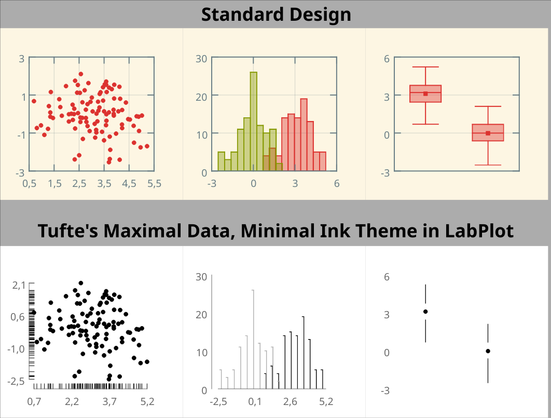
16 followers · 52 posts · Server mstdn.social@bsmall2 If you are interested in Edward Tufte's work, please have a look at @LabPlot, an open-source and cross-platform application for curve fitting, data visualization and analysis.
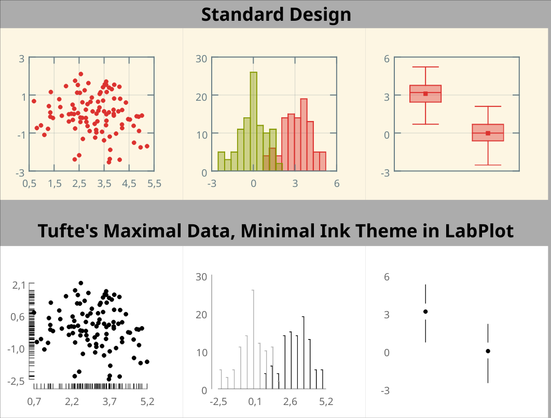
You can get Tufte's "Maximal data, minimal ink" theme for various plots in a single click with @LabPlot.
#EdwardTufte #ChartJunk #Data-Ink-Ratio #DataViz #InfoViz #LabPlot
#labplot #infoviz #dataviz #Data #chartjunk #EdwardTufte
Onemoment · @onemoment
16 followers · 52 posts · Server mstdn.social@taosecurity If you are interested in Edward Tufte's work, please have a look at @LabPlot, an open-source and cross-platform application for curve fitting, data visualization and analysis.
You can get Tufte's "Maximal data, minimal ink" theme for various plots in a single click with @LabPlot.
#EdwardTufte #ChartJunk #Data-Ink-Ratio #DataViz #InfoViz #LabPlot
#labplot #infoviz #dataviz #Data #chartjunk #EdwardTufte
David Chavalarias - FR · @davidchavalarias
75 followers · 35 posts · Server piaille.frLa campagne de recrutement des ingénieurs @CNRS titulaires est ouverte jusqu'au 5 juillet et il y a un poste pour venir travailler avec nous !
A l'Institut des Systèmes Complexes de Paris Île-de-France, sur #GarganText, développez à la pointe de la techno en #textmining #IA #haskell & #infoviz et bien sûr en libre. Go go go! ⬇️
https://iscpif.fr/projects/gargantext/
#gargantext #textmining #ia #haskell #infoviz
David Chavalarias - EN · @davidchavalarias
324 followers · 105 posts · Server fosstodon.orgThe recruitment campaign for tenured @CNRS engineers is open until July 5 and there's a position to come and work with us in Paris ! At the Complex Systems Institute, on #GarganText, you will develop at the cutting edge of #textmining #IA #haskell & #infoviz , etc. And of course, it's a free software ! Go go go!⬇️
https://iscpif.fr/projects/gargantext
#gargantext #textmining #ia #haskell #infoviz
Bharath M. Palavalli · @bmp
36 followers · 112 posts · Server mastodon.sdf.orgInteresting visualization on the deluge of AI models https://informationisbeautiful.net/visualizations/the-rise-of-generative-ai-large-language-models-llms-like-chatgpt/, what is interesting is the proliferation of models with smaller (comparatively) parameter sets. #infoviz #dataviz
Kolotipy.cz · @kolotipy
170 followers · 926 posts · Server mas.toRT @Jachym@twitter.com
1/3 Evropská agentura pro životní prostředí (EEA) nedávno vydala zprávu, ve které mj. píše, že v Evropě ročně zemře přibližně 1200 dětí (osob mladších 18 let) kvůli znečištěnému ovzduší. Proč jsou děti náchylnější? Připravil jsem #infografika. #ovzduší #infoviz #kvalitaovzduší
#kvalitaovzdusi #infoviz #ovzdusi #infografika
Georgina Hibberd · @georgh
74 followers · 87 posts · Server aus.socialBrilliant use of #dataviz storytelling by @ABC Story Lab.
https://www.abc.net.au/news/2023-04-28/stage-three-tax-cuts-to-scale/102268304
Ralph Straumann (@rastrau) · @rastrau
243 followers · 143 posts · Server mstdn.socialWie veröffentlicht man eine automatische #Wetter-Vorhersage in #SocialMedia?
In diesem Blogpost gebe ich Einblick in eine private «Fingerübung». Teil 2 dreht sich um Daten und Programmierung: https://digital.ebp.ch/2023/04/20/wettervorhersage-in-social-media-teil-2-daten-und-programmierung
#infoviz #bot #mastodon #python
#Python #Mastodon #Bot #infoviz #SocialMedia #wetter
Georgina Hibberd · @georgh
69 followers · 68 posts · Server aus.socialJáchym Brzezina · @jachym
87 followers · 59 posts · Server mastodonczech.czDnes je to rok, co jsem zveřejnil svůj nový projekt stránek o vizualizaci dat a informací se zaměřením na životní prostředí - infoviz.cz.
K dnešnímu dni zde najdete 240 infografik, 40 faktografik a například stránku věnovanou druhům oblaků.
Jedná se o čistě volnočasovou a nekomerční aktivitu. Pokud vás web zaujal, budu rád za jakoukoliv zpětnou vazbu, popř. sdílení, což je jediný způsob její propagace.
#pocasi #klima #voda #ovzdusi #dataviz #infoviz
Chrono Matthias · @chronohh
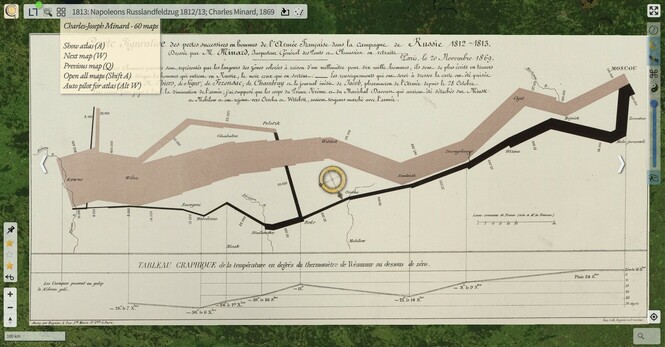
390 followers · 689 posts · Server norden.social@elm @sigchi @hcil_umd /cf. Minard’s #infoviz chart on Napoleon’s war against Moscow: #ChronoLink https://mprove.de/chrono?q=54.55259,30.15545&z=5.65&m=BFbtv1b10484829h-51n&o=0.5&d=1
Mia · @mia
1253 followers · 805 posts · Server hcommons.socialI wrote a quick post on the animation packed full of different visualisations that @kallewesterling and I made for the @LivingWithMachines exhibition https://livingwithmachines.ac.uk/leeds-over-time-as-seen-through-a-data-science-lens/
#datascience #digitalhistory #infoviz #infovis #design
Onemoment · @onemoment
13 followers · 41 posts · Server mstdn.socialEdward Tufte offers two principles for making efficient graphical representations:
- erase non-data-ink, within reason.
- erase redundant data-ink, within reason.
Above all, show the data! Tufte
Do you know that you can get Tufte's "MAXIMAL DATA, MINIMAL INK" theme for plots in a single click with @LabPlot via Theme > Tufte?
Get the project via File > Open Example.
#LabPlot #Tufte #ChartJunk #Data-Ink-Ratio #DataViz #InfoViz #Visualization #CognitiveLoad #Minimalism #Simplicity #OpenSource
#Simplicity #Data #chartjunk #OpenSource #minimalism #CognitiveLoad #visualization #infoviz #dataviz #tufte #labplot
Adrian Brasoveanu · @adrianb82
1 followers · 7 posts · Server ohai.socialLights, Camera, Action! 🎬 The @webLyzard Video Tutorial Series introduces the "Dashboard LITE", a simple yet powerful tool to track the public debate across news, social media and stakeholder websites ➡️ youtu.be/w_kB8u2tNkU 📈 #InfoViz #DataScience #AI #DigitalMarketing
#infoviz #datascience #ai #digitalmarketing
Jáchym Brzezina · @jachym
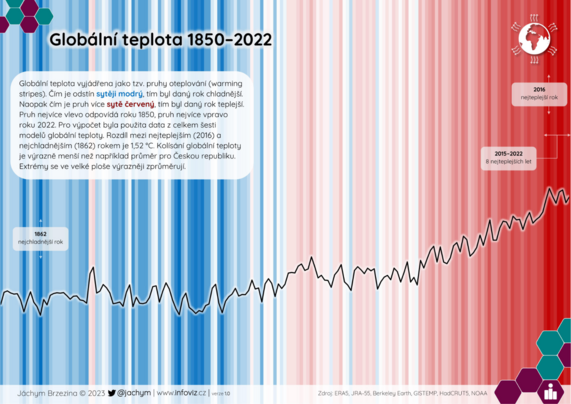
73 followers · 51 posts · Server mastodonczech.czPruhy oteplování (tzv. warming stripes) se staly jedním ze symbolů globálního oteplování. Zpracoval jsem tedy novou svoji verzi, která již zahrnuje data za rok 2022. Pruhy jsem doplnil o několik dalších informací.
#teplota #klima #podnebi #infoviz #warmingstripes
