
Meagan Longoria · @Mmarie
344 followers · 412 posts · Server techhub.socialIt's time for another challenge!
Andy Kriebel is again inspiring us - we're recreating his #MakeoverMonday challenge using the line chart core visual in #PowerBI. Join us for a fun challenge that includes #PBICoreVisuals, #DAX, and a hack!
https://t.co/4LDV6uOahy
#makeovermonday #powerbi #pbicorevisuals #dax

BronMason · @bronakins
285 followers · 1128 posts · Server sfba.socialEach day should have a #hastag so the catless can join. Here are some suggestions, which can be improved upon!!
#Sinday (focused on the 7 deadly, like Grumpy, Sleepy…Dasher Dancer … oops)
#makeovermonday (self-explanatory),
#TodoTuesday (reveal your ToDo list)
#WackyWednesday (anything goes),
#ThrowbackThursday (if it’s good enough for FB…)
#FryDay (Yup—anything that can be fried), and of course
#caturday retains it’s anchor position (if it ain’t broke don’t fix it).
Who’s in??????
#hastag #sinday #makeovermonday #todotuesday #WackyWednesday #throwbackthursday #fryday #caturday
Meagan Longoria · @Mmarie
324 followers · 256 posts · Server techhub.social#WoW2023 friends - this week's challenge is one everyone can enjoy! We took inspiration from #MakeoverMonday to create a bar chart and a what-if parameter in #PowerBI. Check out the report to see if you, too, are overcaffeinated!
#wow2023 #makeovermonday #powerbi

Marc Reid · @marcreid
43 followers · 19 posts · Server vis.social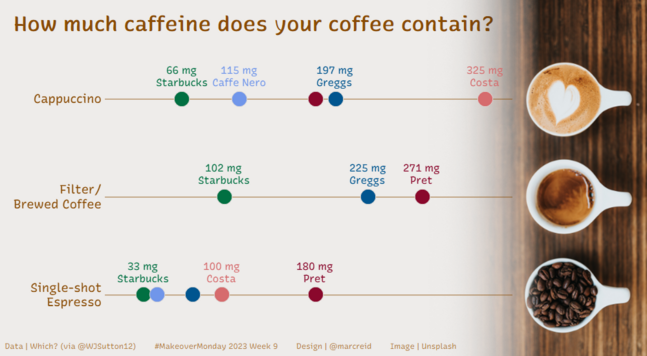
A dot plot for this week's #MakeoverMonday
How much caffeine does your coffee contain?
Data - Which?
Tableau Public -> https://tabsoft.co/3Za7Nhi
#Tableau #dotplot
#dotplot #tableau #makeovermonday

Stefan Bohacek · @stefan
735 followers · 494 posts · Server stefanbohacek.online
Updated my #MakeoverMonday #dataviz for week 5 to use a full-page map.
https://data.stefanbohacek.dev/projects/makeover-monday/2023w5
Looks much better.
#makeovermonday #dataviz #nyc #food #map #mapbox
Stefan Bohacek · @stefan
735 followers · 457 posts · Server stefanbohacek.onlineI haven't participated in #MakeoverMonday in a while, so this was a great opportunity to finally use Mapbox on a project.
https://data.stefanbohacek.dev/projects/makeover-monday/2023w5
#makeovermonday #data #dataviz #nyc #food #pizza #map #mapbox

Rackuur :artpaw: · @Rackuur
77 followers · 1011 posts · Server mastodon.art
#birdhouse on #birdhousemonday needed a #makeover on #makeovermonday :blobbybara:
Hope the Birds will like it
#makeovermonday #makeover #birdhousemonday #birdhouse

DatavizAdventure · @Datavizadventure
26 followers · 16 posts · Server vis.socialHi #datafam, here a personal project that I made with data from #makeovermonday (2022).
"Which country gets the most paid vacation days?"
Thanks!
https://www.behance.net/gallery/162024039/Which-country-gets-the-most-paid-vacation-days
.
.
.
.
.
.
.
#dataviz #datavisualization #DataAnalytics #vacations #data #worldwide #informationdesign
#informationdesign #worldwide #data #vacations #dataanalytics #datavisualization #dataviz #makeovermonday #datafam

Matt Hawkins · @matthawkins
54 followers · 45 posts · Server data-folks.masto.hostAccording to *absolutely watertight, irrefutable #data*, I know Americans better than they know themselves.
I played around with a #MakeoverMonday data set from a couple of weeks ago (plus some self-generated data) this morning, and this is what came out.
https://hotcrossjoin.substack.com/p/do-i-know-americans-better-than-they
#data #makeovermonday #datadon #tableau

· @martinwaring
3 followers · 10 posts · Server qoto.orgWell, my first attempt at a #MakeOverMonday as I continue to learn/play #Tableau
Current thoughts, compared to #QlikView, I like Tableau's simplicity to create a simple visualisation and the Story elements look cool, but need to figure out (learn) calculated fields and its version of Set Analysis.
Also, feels less free than QlikView, but that is probably a lack of knowledge on my part.
#makeovermonday #qlikview #tableau

Jaz 🏴 · @jaz
5607 followers · 12040 posts · Server toot.wales<<RT @sybil_dias: Hurrying my #MakeoverMonday 2019/W6 attempt (#Superbowl /#HalftimeShow ). Simple dataset for this week.
Feedback welcome. Thank you @VizWizBI /@TriMyData
Jaz 🏴 · @jaz
5607 followers · 12040 posts · Server toot.wales<<RT @sybil_dias: #MakeoverMonday '19/W4: slow to post; Corrections welcome; Used defra 2017 (scope 2) conversion CO2e. 2 Charts in 1 viz. Hover over details in chart, and use highlight/scrollbar to see variations in readings by day/time. Thnx @VizWizBI @TriMyData / https://t.co/ICdOB1ecn3 https://t.co/DiHIN5WvDI>>