
amanda · @acrobins
49 followers · 33 posts · Server mapstodon.space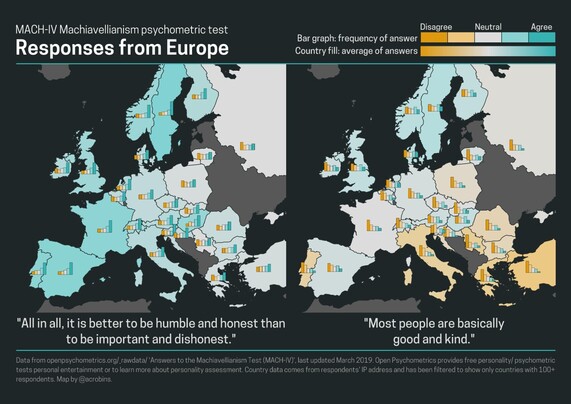
The #MapPromptMonday theme this week is 'map of personalities'. Here are 15k+ European responses to a couple of the questions in the MACH-IV 'Machiavellianism test', using raw data from openpsychometrics.org... intended just for fun although the results are interesting

Georgios Karamanis · @georgios
489 followers · 97 posts · Server vis.social
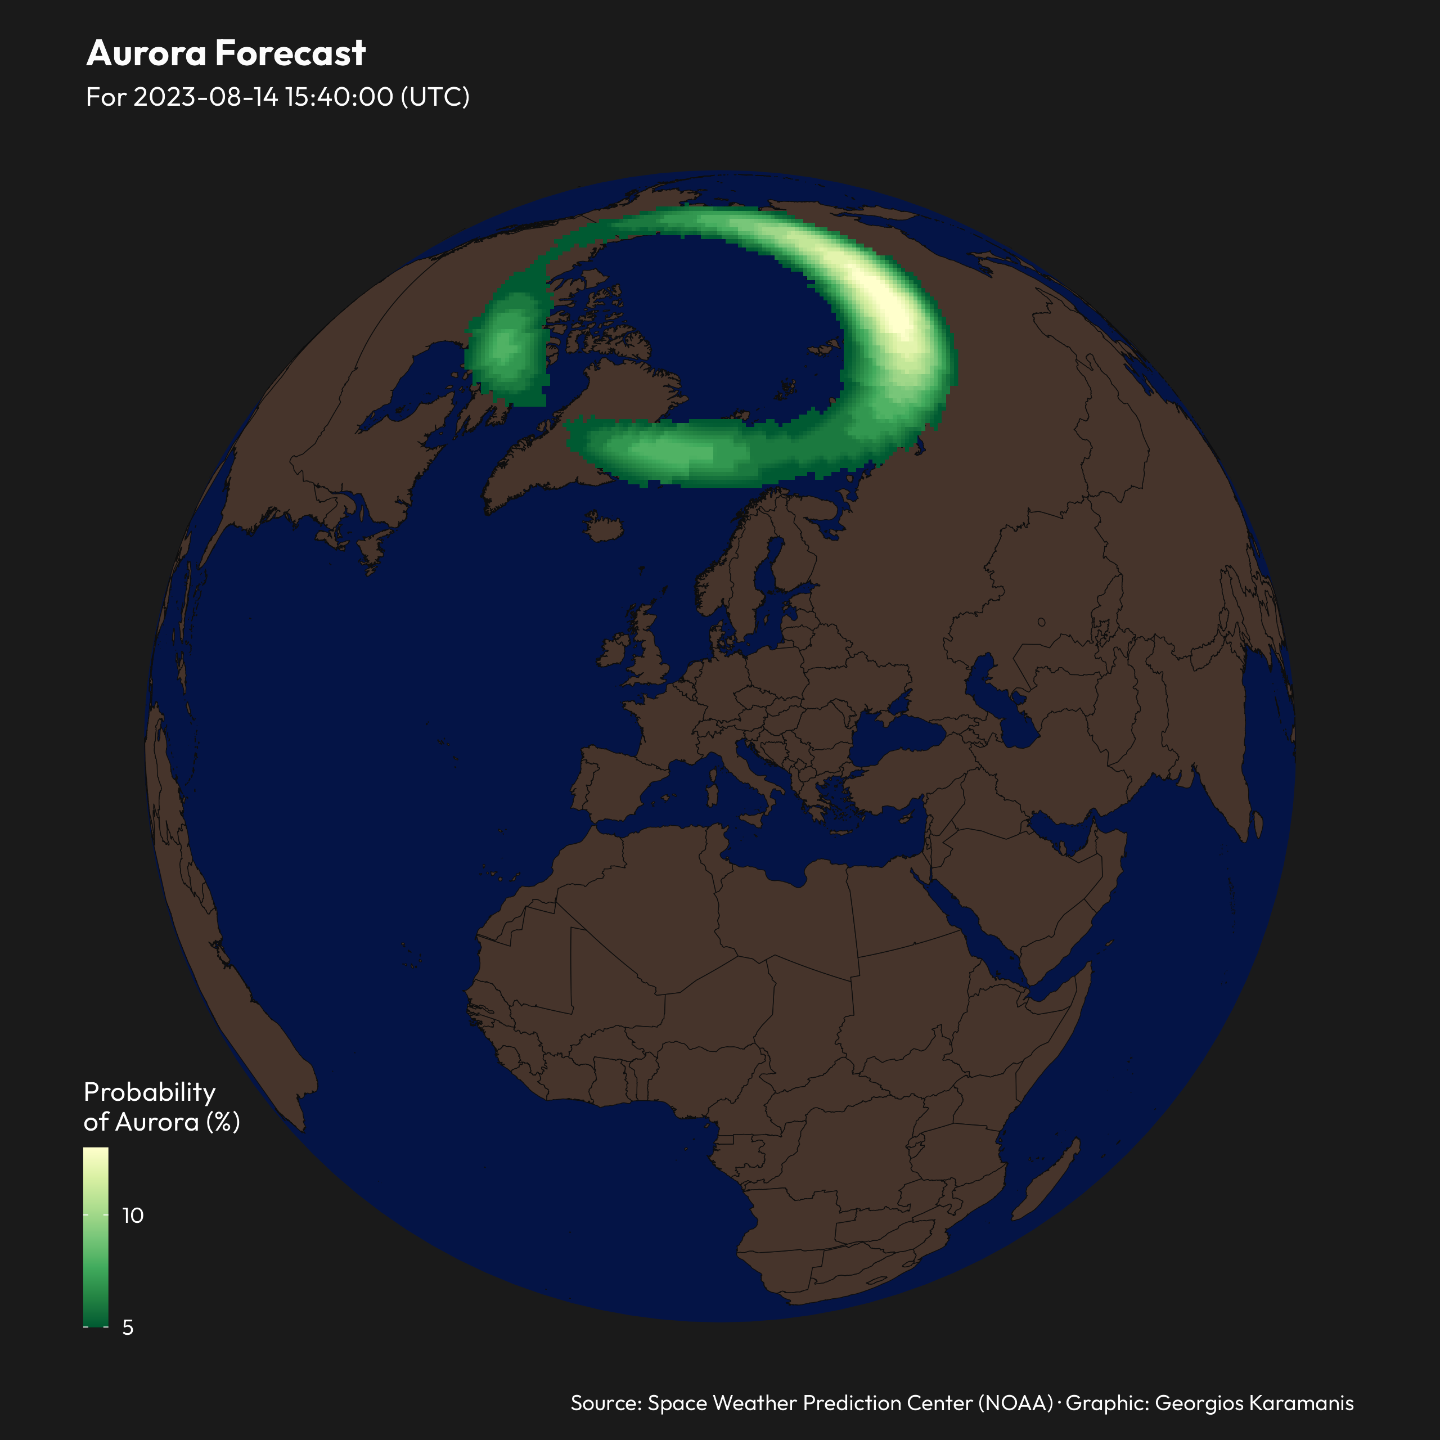
Aurora forecast for the week of July 24-30 of #MapPromptMonday, Natural Wonders
Code: https://github.com/gkaramanis/mappromptmonday/tree/master/2023/2023-week_30
#spatial #dataviz #rstats #mappromptmonday
Georgios Karamanis · @georgios
476 followers · 94 posts · Server vis.social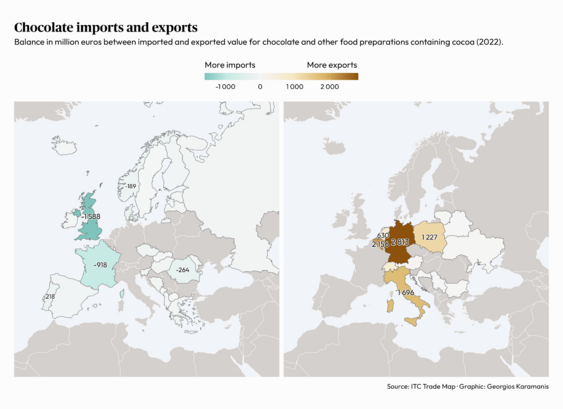
Chocolate trade balance for the week of July 17-23 of #MapPromptMonday, Desserts
Code: https://github.com/gkaramanis/mappromptmonday/tree/master/2023/2023-week_29
#spatial #dataviz #rstats #mappromptmonday
Georgios Karamanis · @georgios
449 followers · 89 posts · Server vis.social
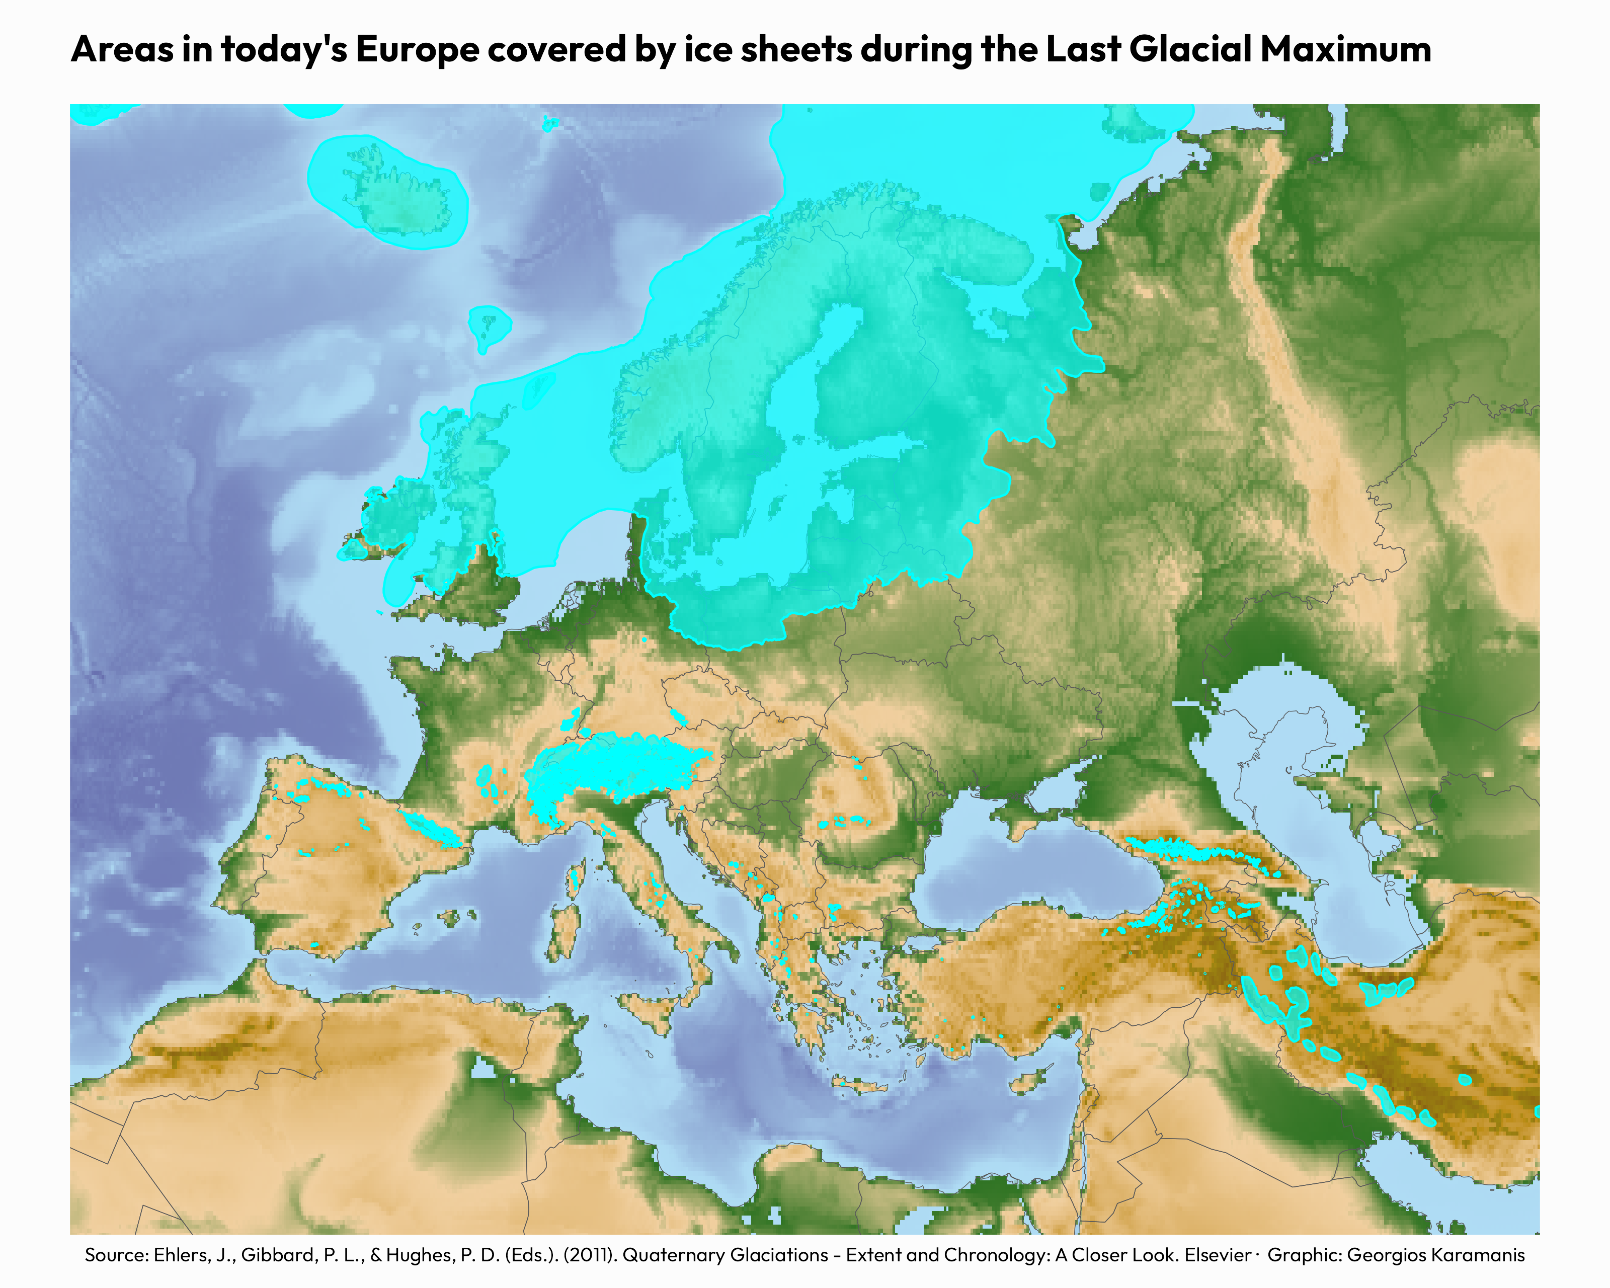
Areas in today's Europe covered by ice during LGM for the week of 3-10 July of #MapPromptMonday, Snow or Ice
Shapefiles for the ice sheets: https://booksite.elsevier.com/9780444534477/digital_maps.php
Code: https://github.com/gkaramanis/mappromptmonday/tree/master/2023/2023-week_27
Georgios Karamanis · @georgios
434 followers · 85 posts · Server vis.social
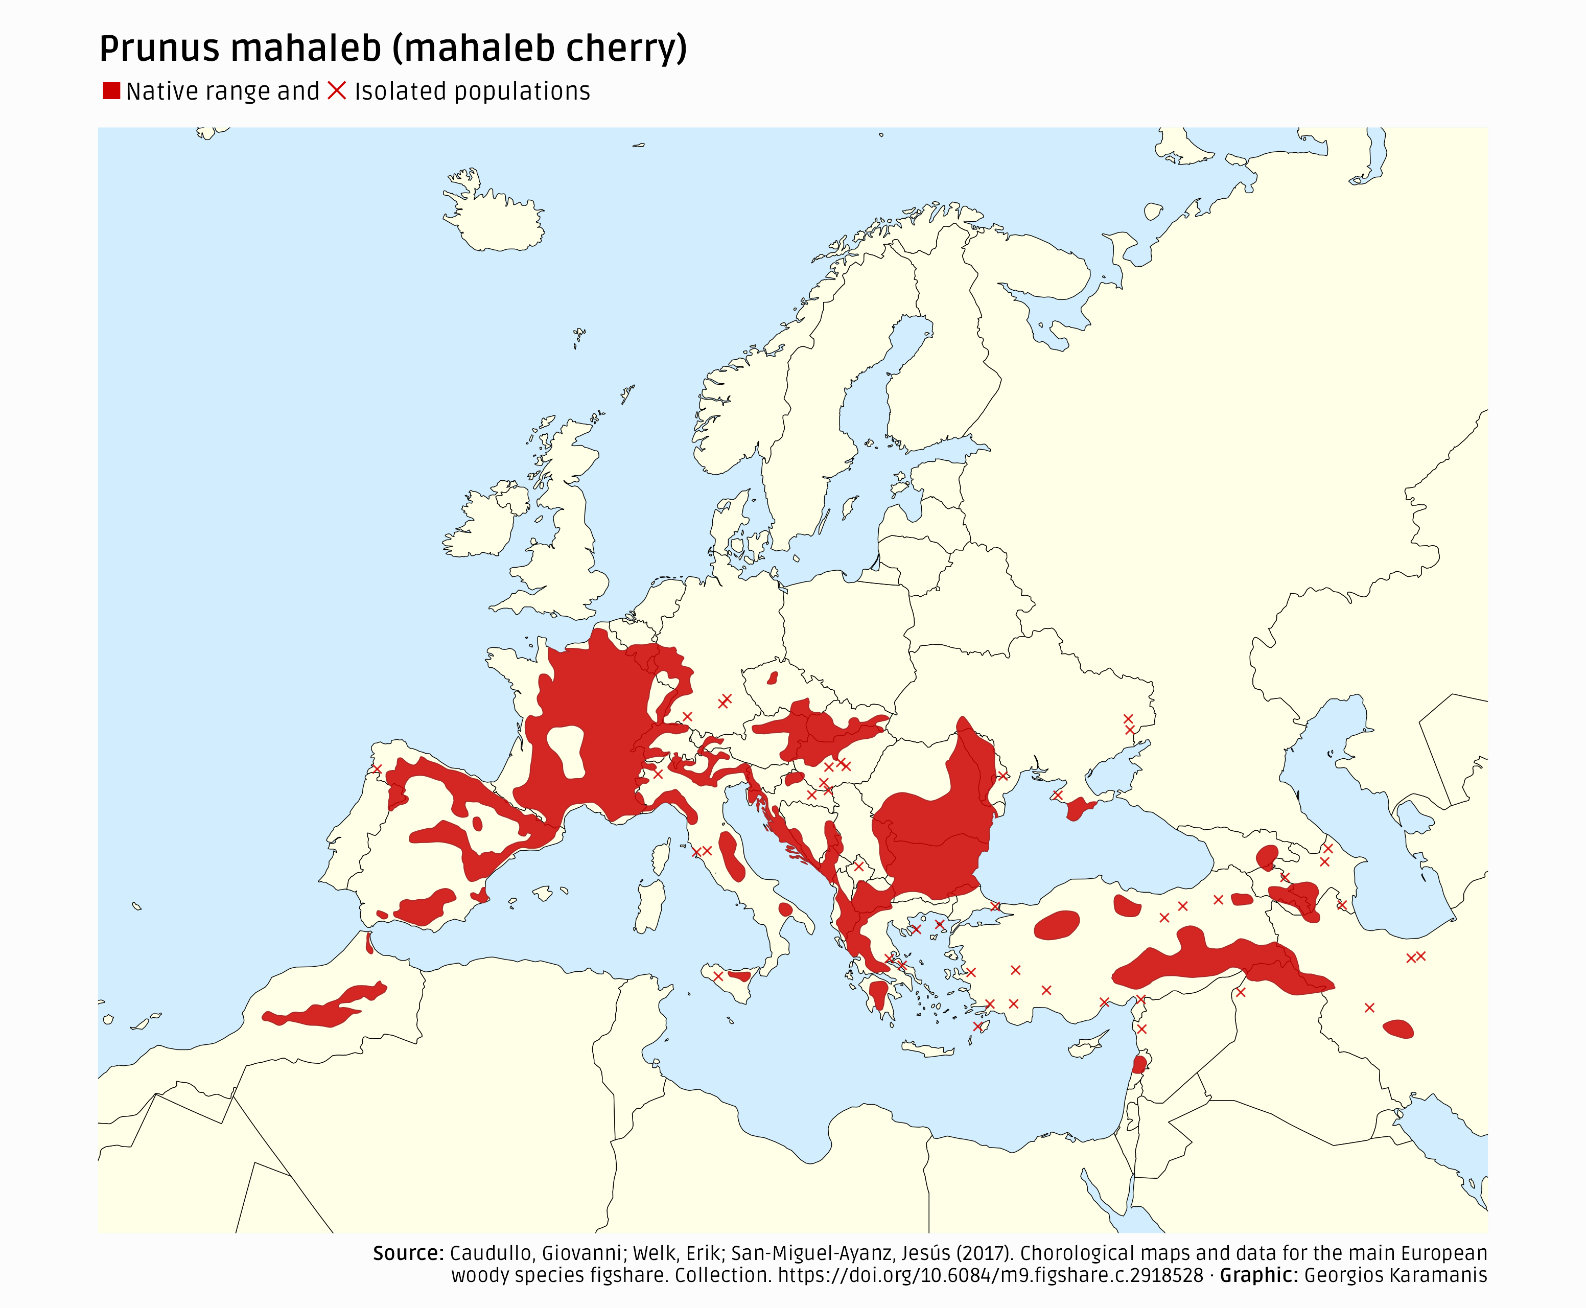
Distribution of the mahaleb cherry for the week of 26 June-2 July of #MapPromptMonday, Plants
Code: https://github.com/gkaramanis/mappromptmonday/tree/master/2023/2023-week_26
#dataviz #rstats #mappromptmonday

Lisa Hornung · @LisaHornung
513 followers · 168 posts · Server fosstodon.org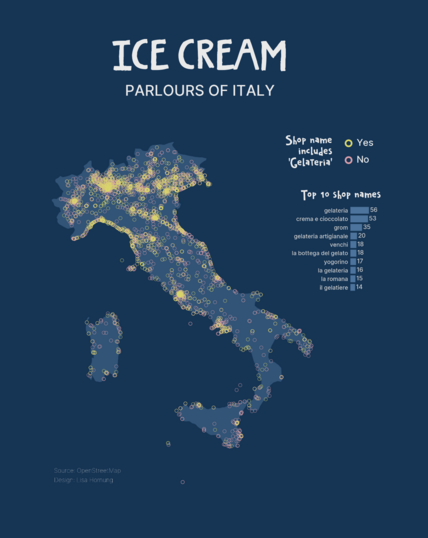
#MapPromptMonday Dessert - Ice cream parlours of Italy 🍨 🇮🇹
The most common shop name is simply “Gelateria” and about 1/3 of shops include “Gelateria” as part of their name.
Data from #OpenStreetMap, made in #python + #matplotlib – full code here https://github.com/Lisa-Ho/small-data-projects#072023-gelaterias-of-italy
#mappromptmonday #openstreetmap #python #matplotlib
Georgios Karamanis · @georgios
414 followers · 78 posts · Server vis.social
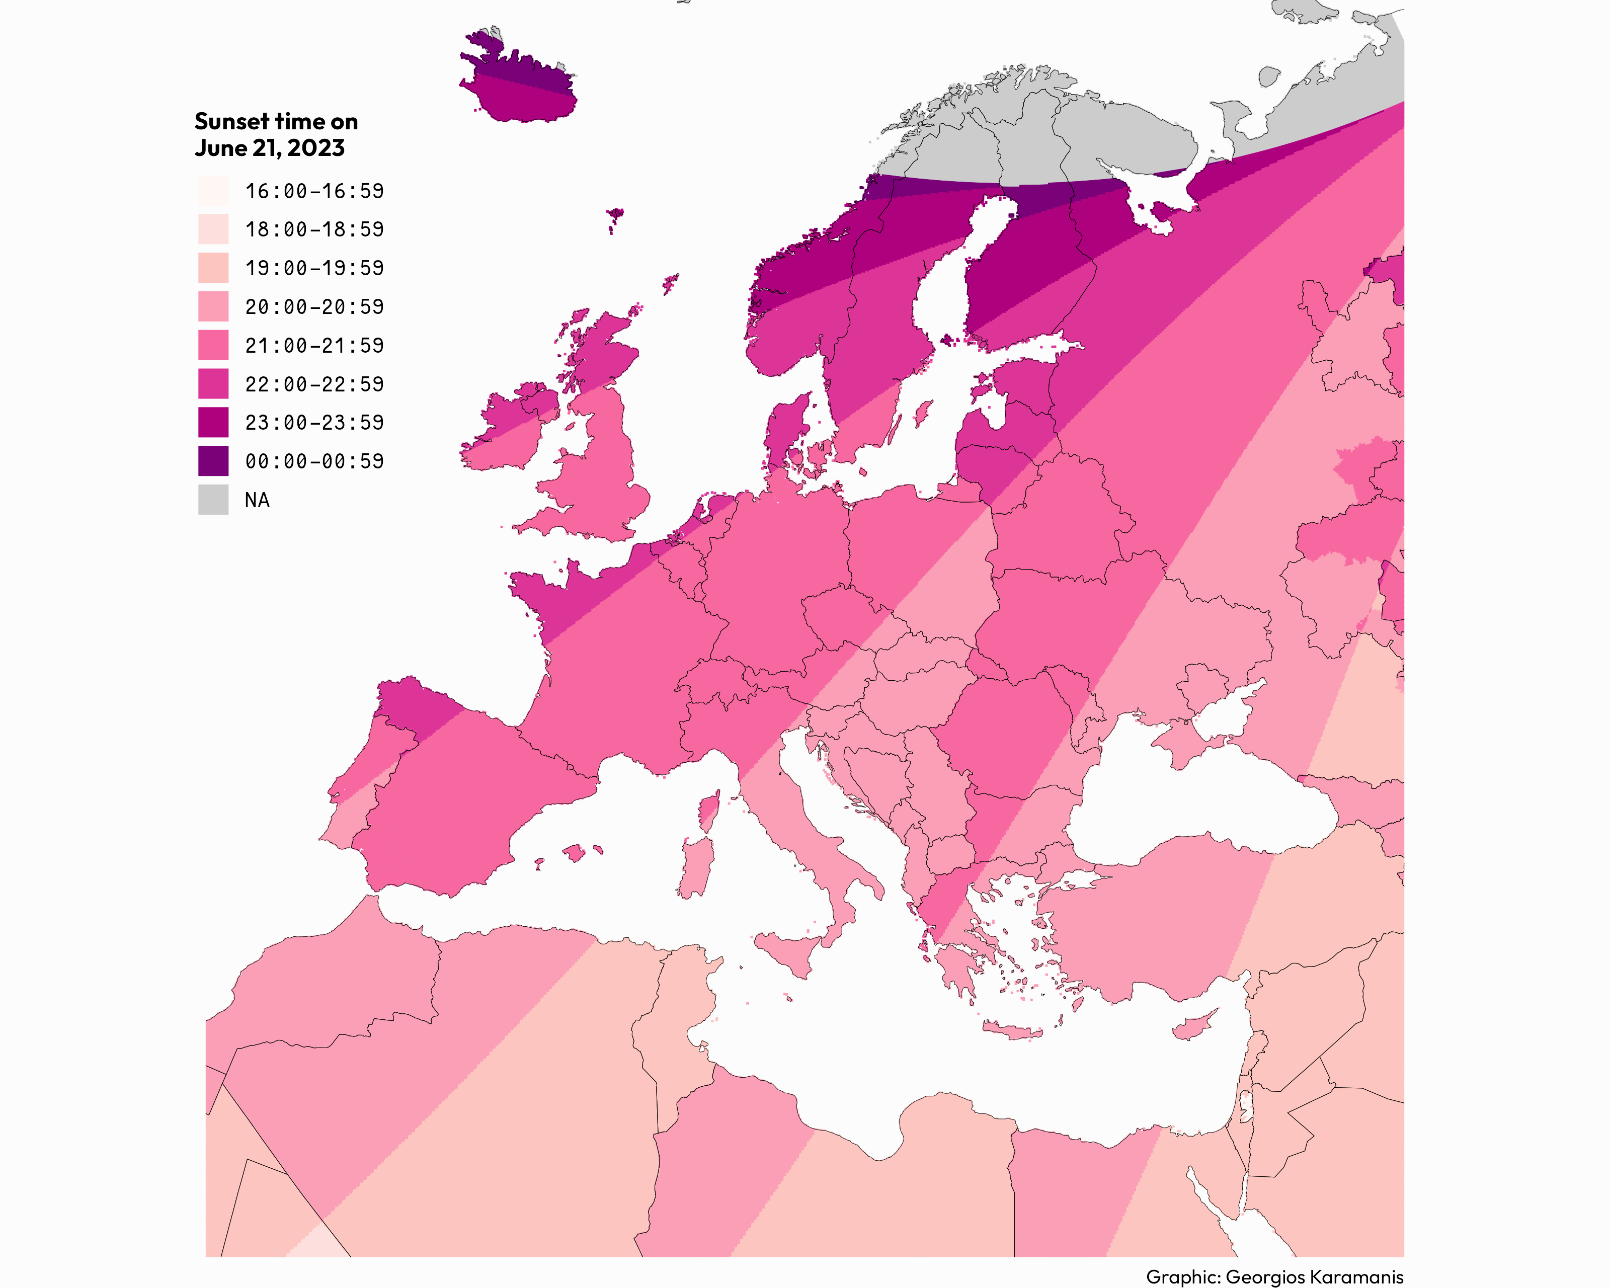
Sunset times on June 21, 2023 for the week of 19-25 June of #MapPromptMonday, Solstice/Seasons
Original idea by Brian Brettschneider: https://twitter.com/Climatologist49/status/1538167056515727360
Code: https://github.com/gkaramanis/mappromptmonday/tree/master/2023/2023-week_25
#dataviz #rstats #mappromptmonday

Sandon Lettieri · @XenonGT
12 followers · 9 posts · Server mapstodon.space
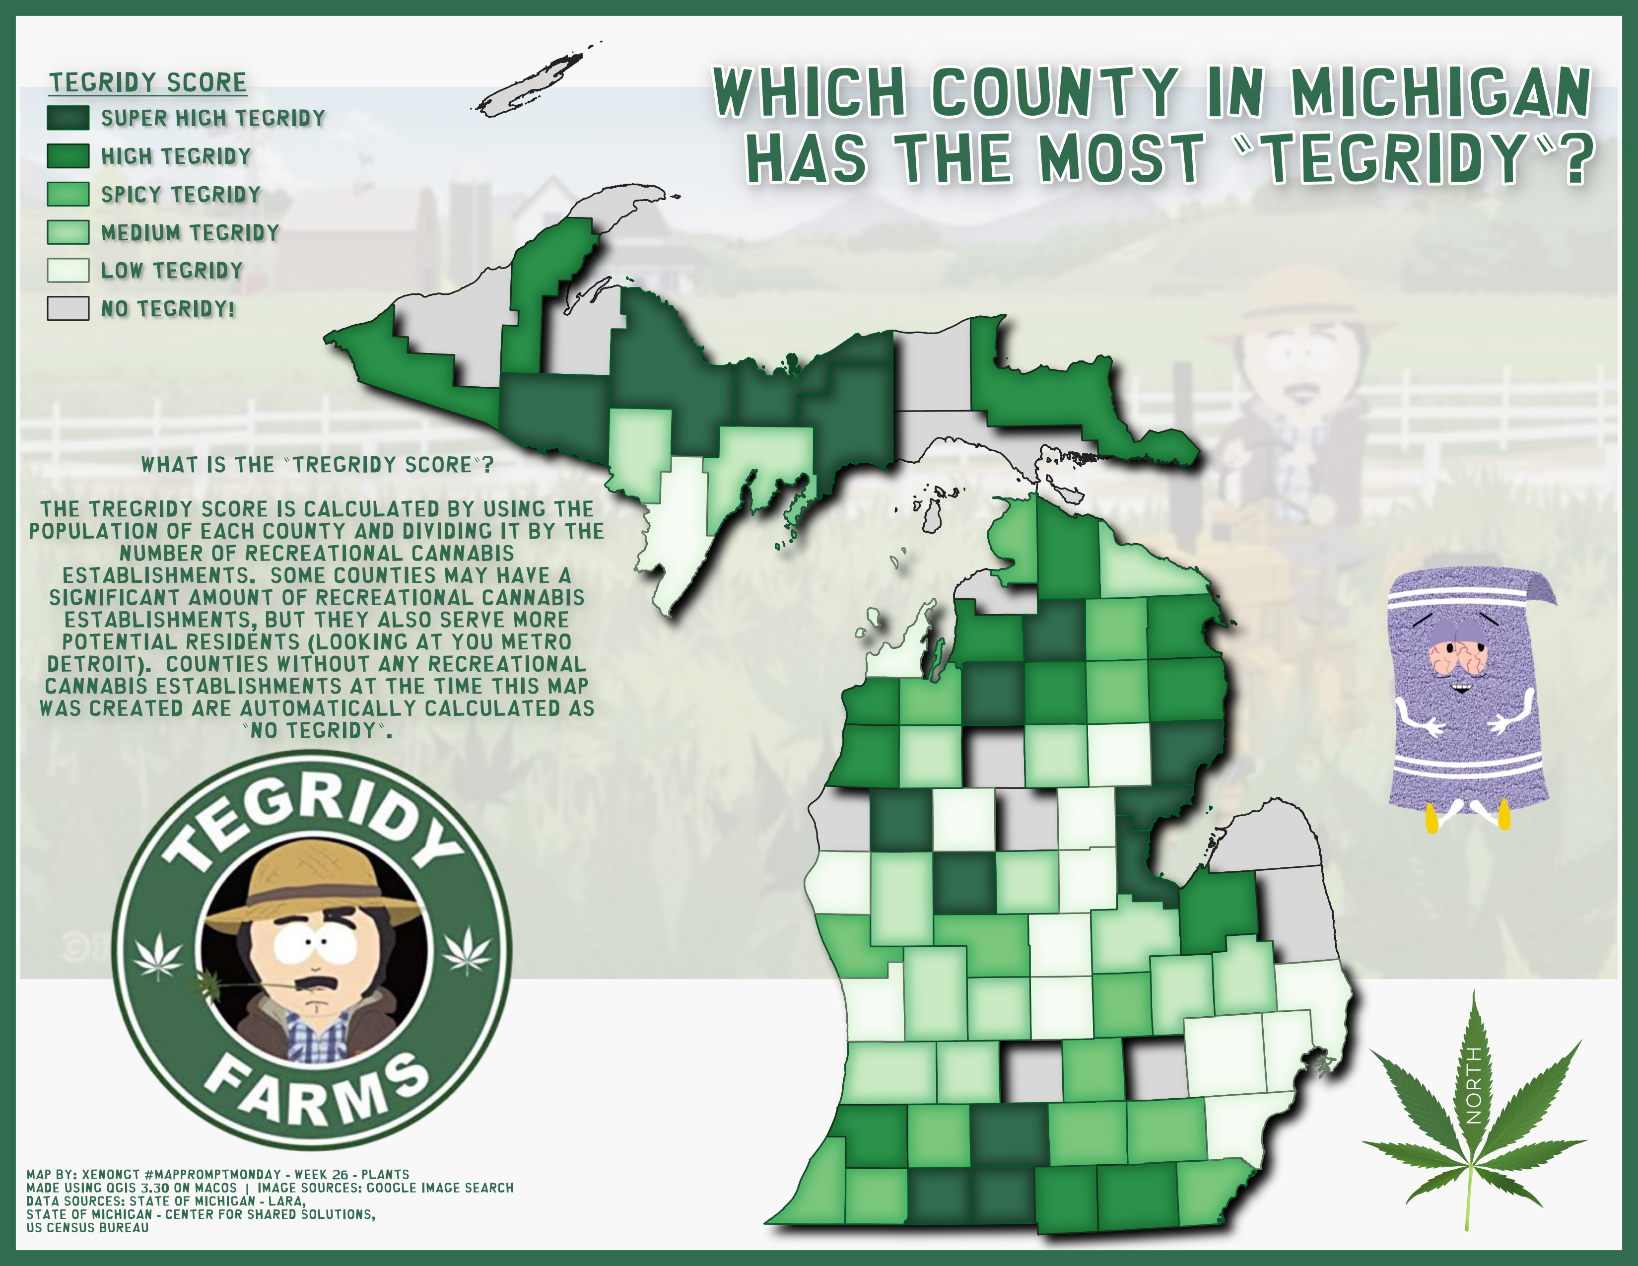
#MapPromptMonday | Week 26 | Plants
This week I went with an obvious subject but added some South Park flair by building a map that "Tegridy Farms" might make of Michigan showing the concentration of recreational cannabis establishments. I thought it made a really fun theme for a map. #QGIS #gischat #southpark
#mappromptmonday #qgis #gischat #southpark
Lisa Hornung · @LisaHornung
327 followers · 139 posts · Server fosstodon.org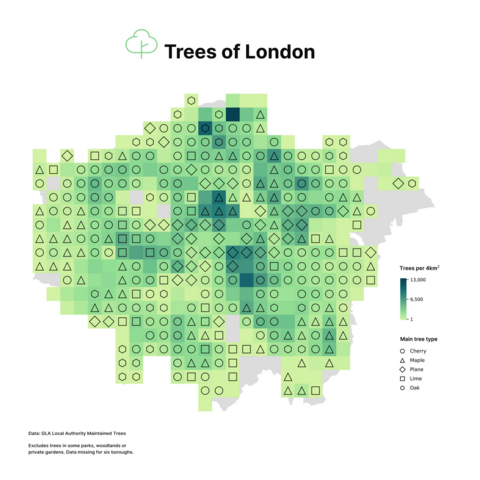
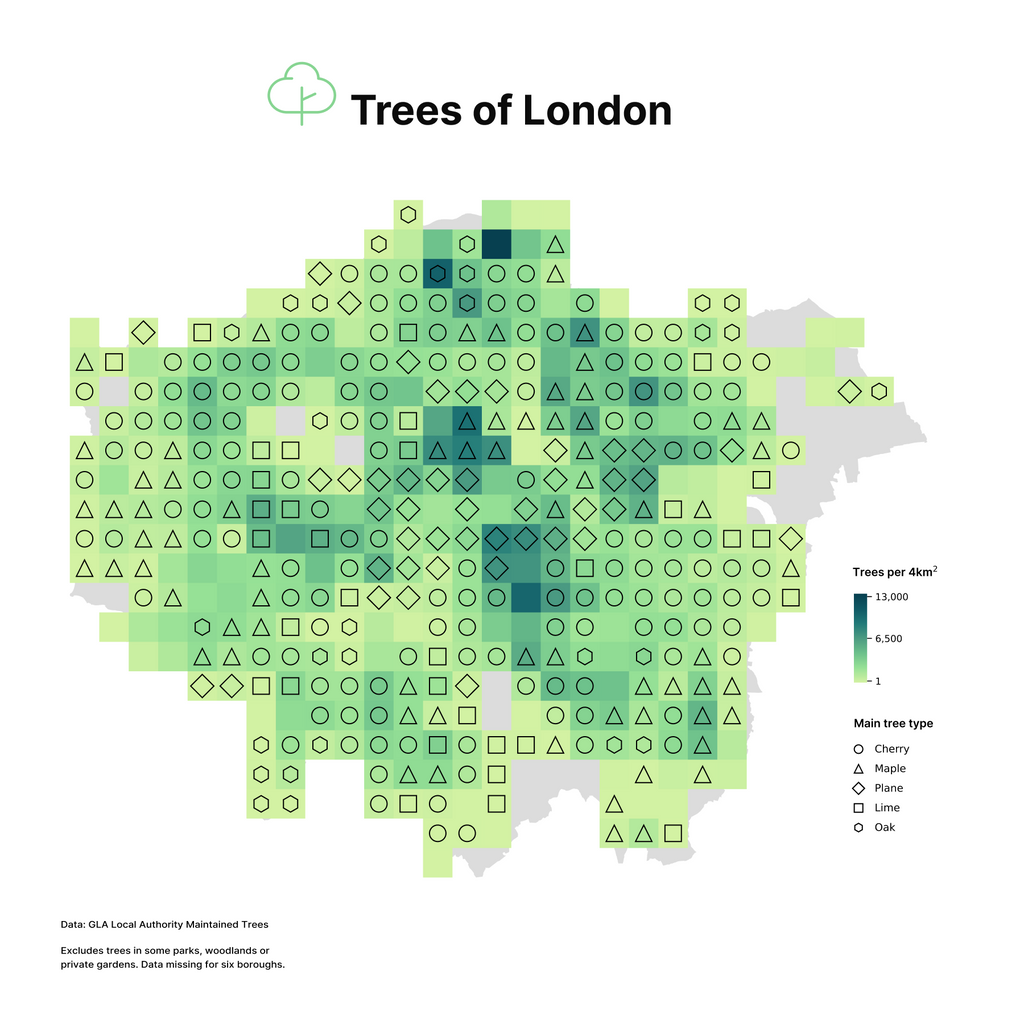
Trees of London for this week's #MapPromptMonday - Plants 🍃
Shows total trees maintained by Local Authorities and main type per 4sqkm. London's urban forest provides an important ecosystem and plays a major role in improving air pollution and temperature reduction. If you want to find out more, checkout the London tree report https://www.london.gov.uk/programmes-and-strategies/environment-and-climate-change/environment-publications/valuing-londons-urban-forest
Made with #python matplotlib
Code https://github.com/Lisa-Ho/small-data-projects/blob/main/2023/2306-trees-london/trees-london.ipynb
#mappromptmonday #python #maps #dataviz #environment
Georgios Karamanis · @georgios
363 followers · 76 posts · Server vis.social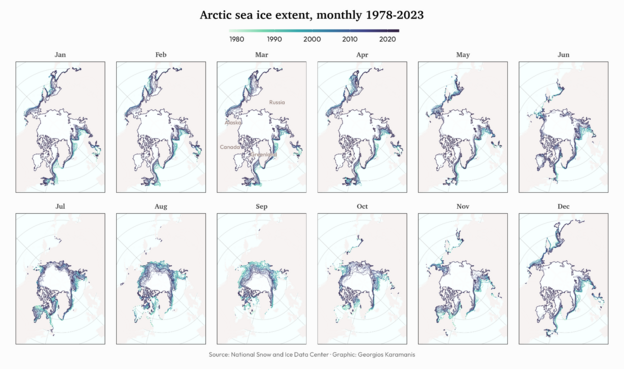
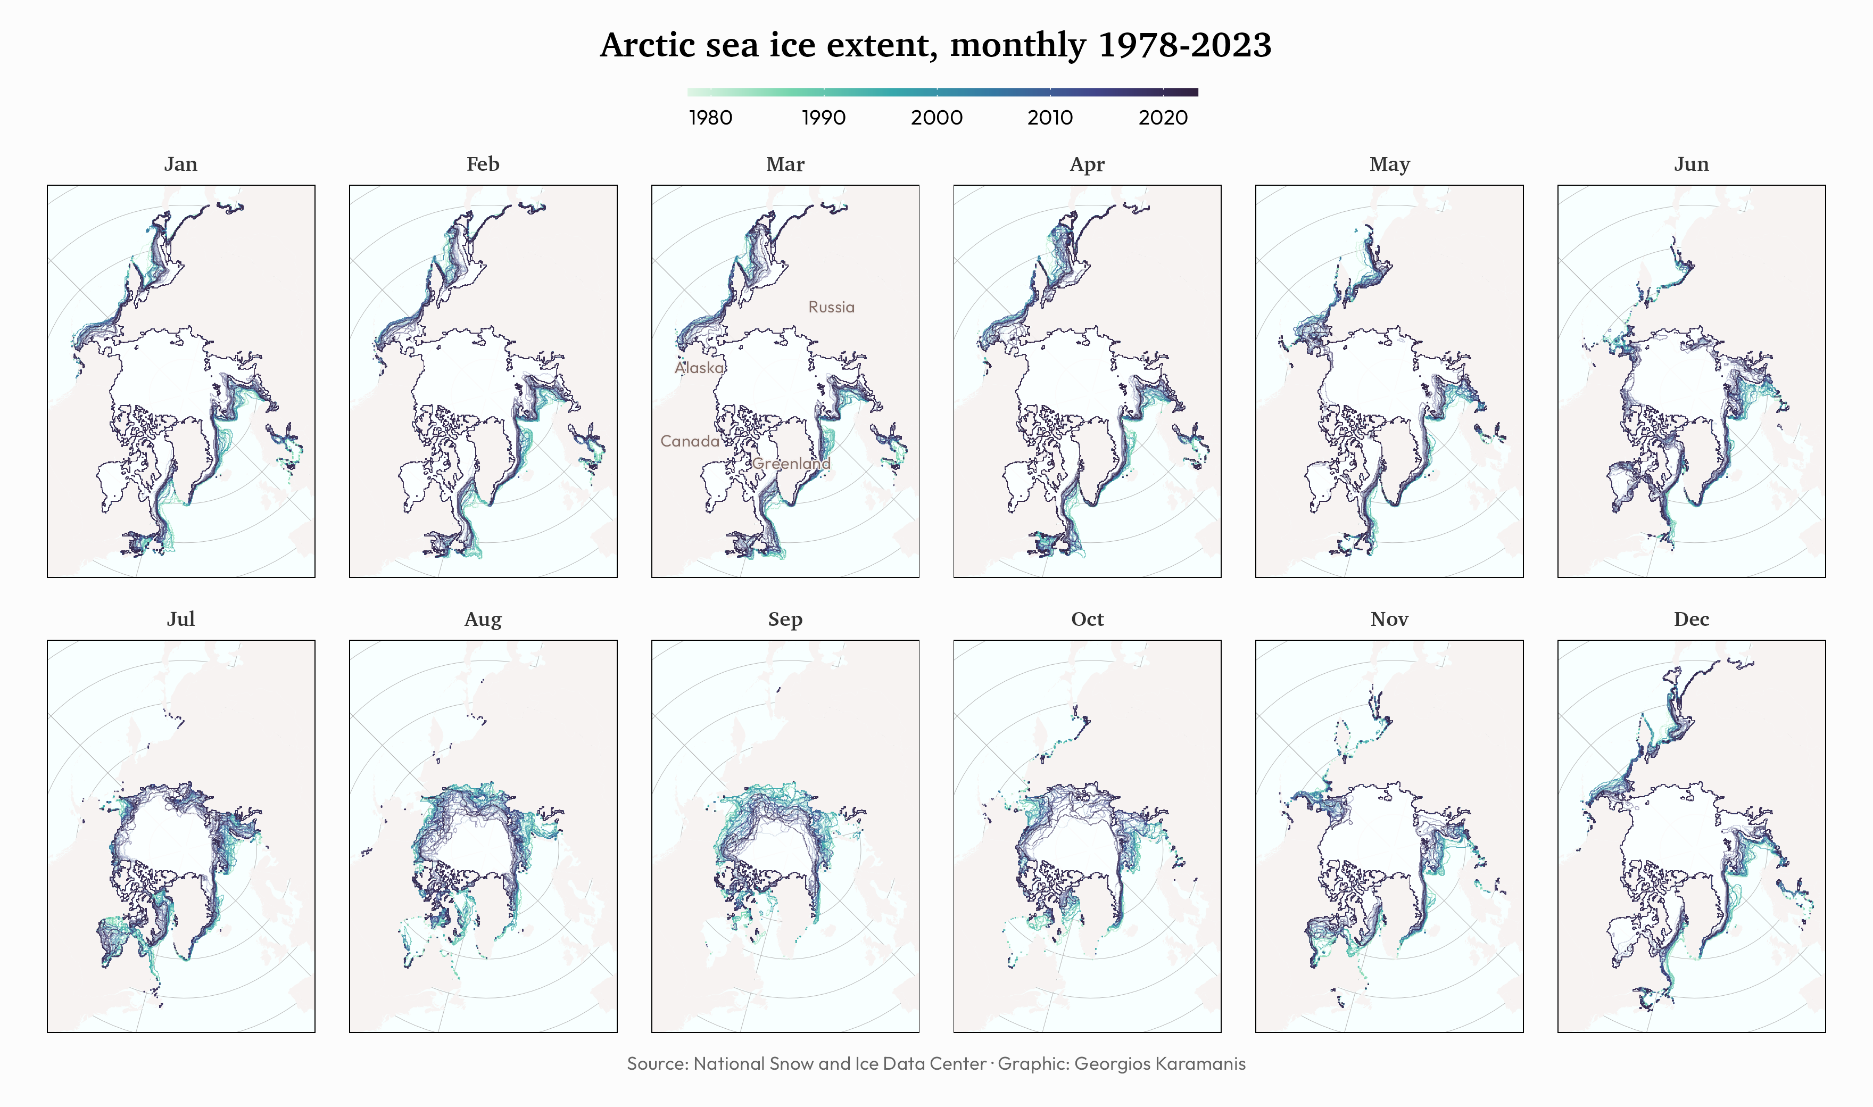
Arctic sea ice extent for this week's #MapPromptMonday, Arctic or Antarctic
Code: https://github.com/gkaramanis/mappromptmonday/tree/master/2023/2023-week_24
#dataviz #rstats #mappromptmonday
Georgios Karamanis · @georgios
362 followers · 73 posts · Server vis.social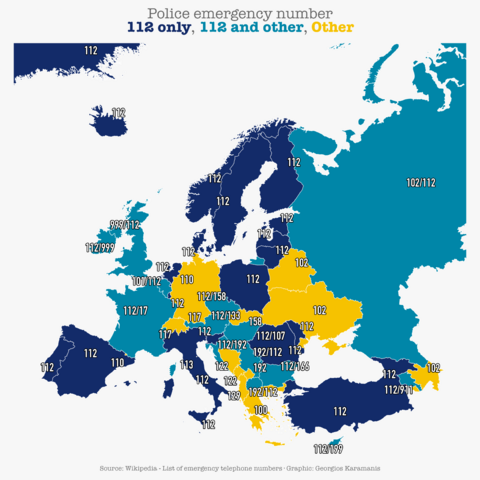
Europe's police emergency numbers for this week's #MapPromptMonday, Safety
Code: https://github.com/gkaramanis/mappromptmonday/tree/master/2023/2023-week_23
Source: https://en.wikipedia.org/wiki/List_of_emergency_telephone_numbers
#dataviz #rstats #mappromptmonday
Georgios Karamanis · @georgios
351 followers · 71 posts · Server vis.social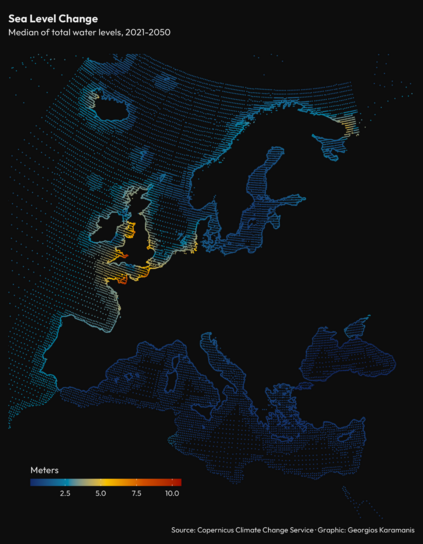
Sea level change for this week's #MapPromptMonday, Cimate Change Vulnerability
Code: https://github.com/gkaramanis/mappromptmonday/tree/master/2023/2023-week_22
#dataviz #rstats #mappromptmonday
Georgios Karamanis · @georgios
351 followers · 70 posts · Server vis.social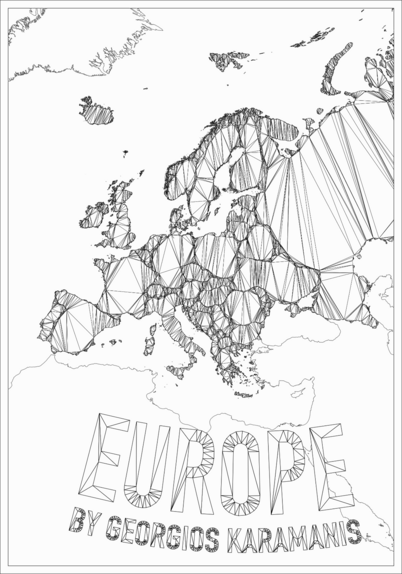
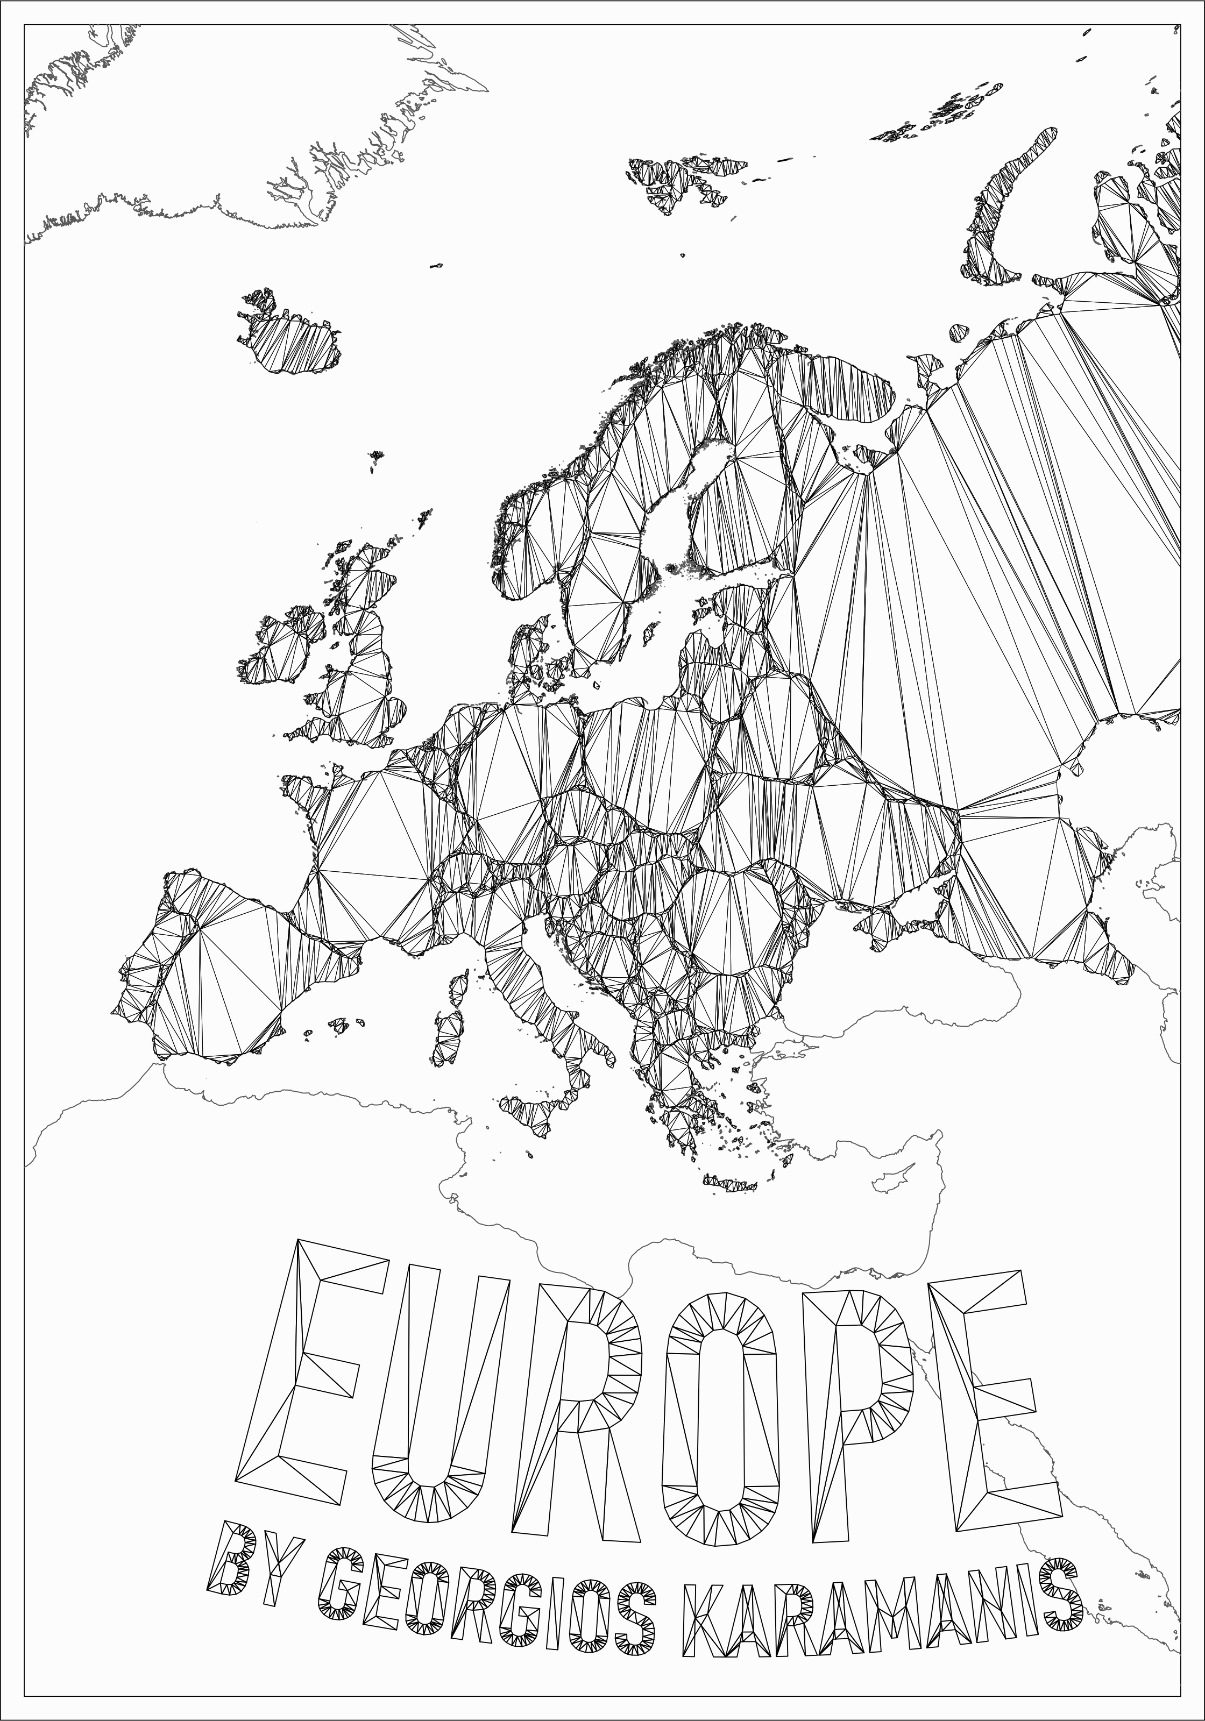
Europe with constrained triangulation for last week's #MapPromptMonday, Book Cover
Code: https://github.com/gkaramanis/mappromptmonday/tree/master/2023/2023-week_21
#dataviz #rstats #mappromptmonday
Georgios Karamanis · @georgios
351 followers · 68 posts · Server vis.social
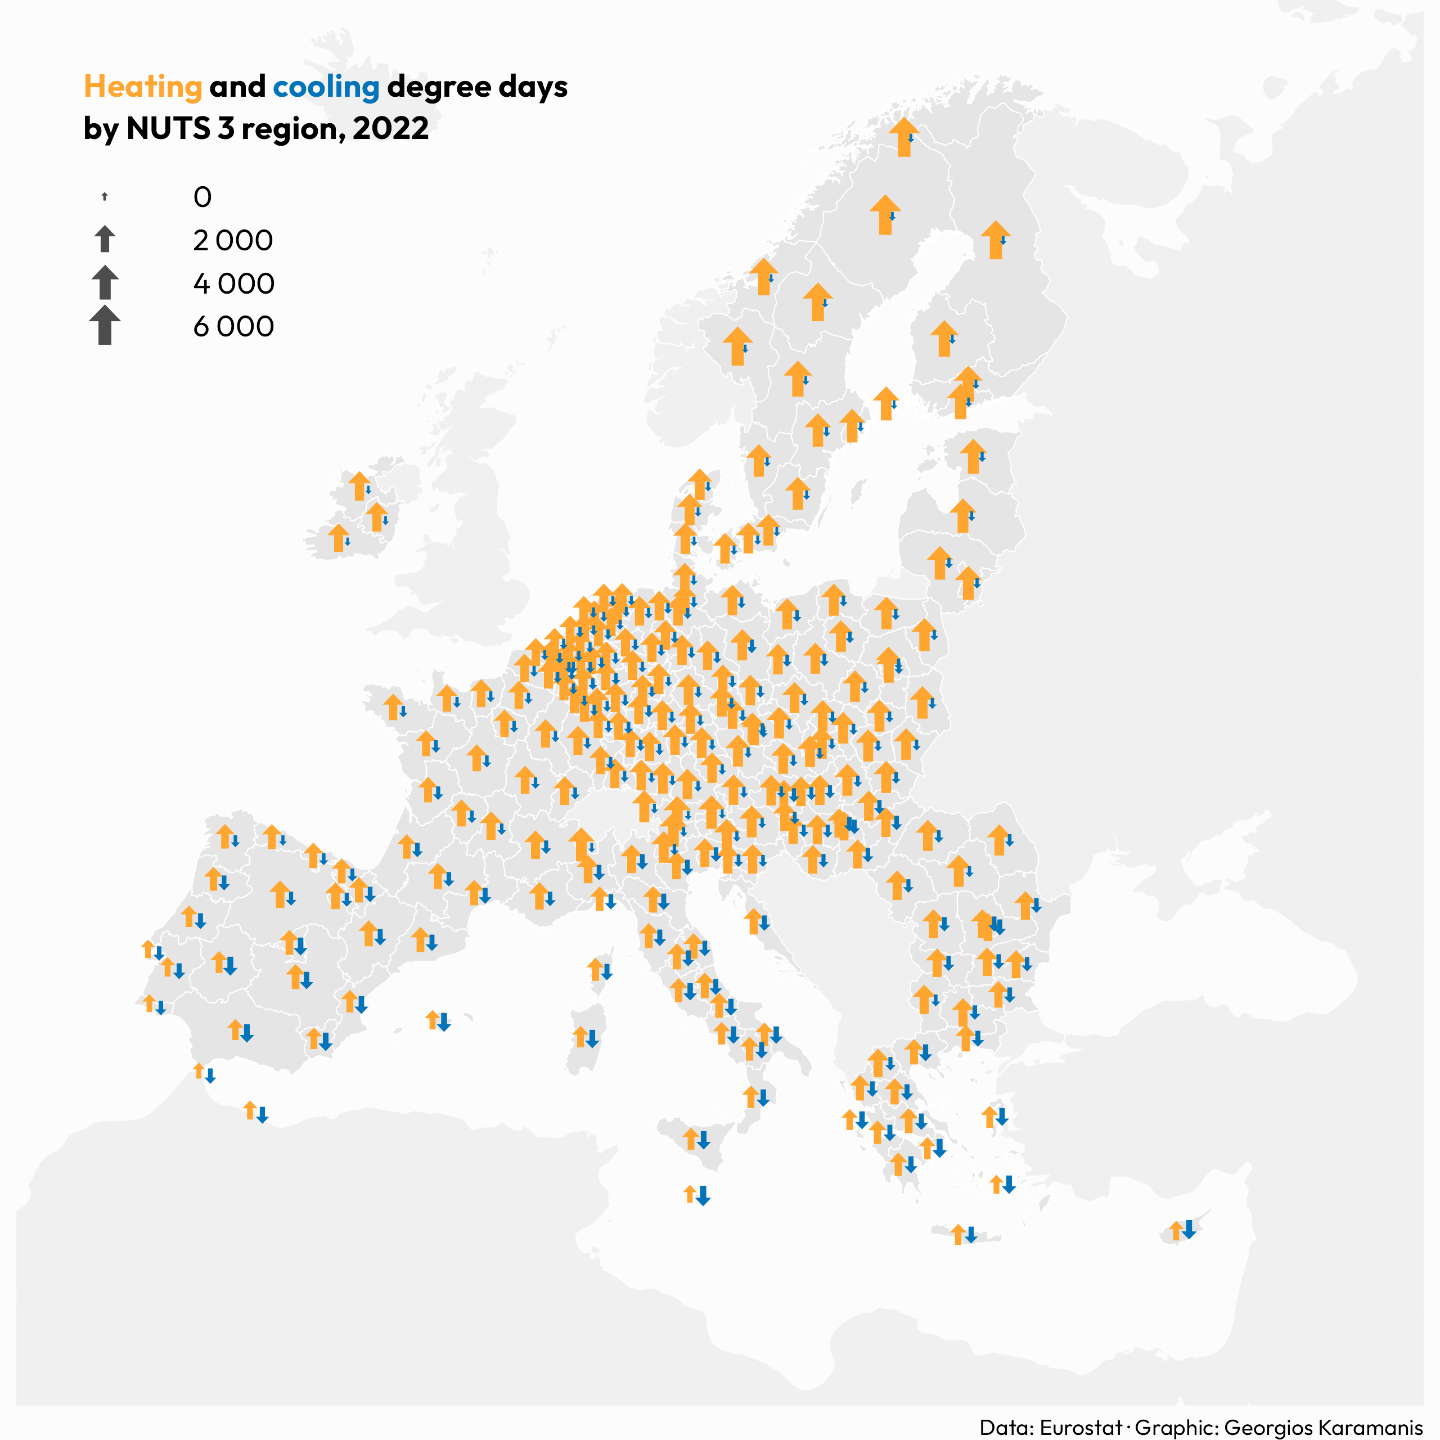
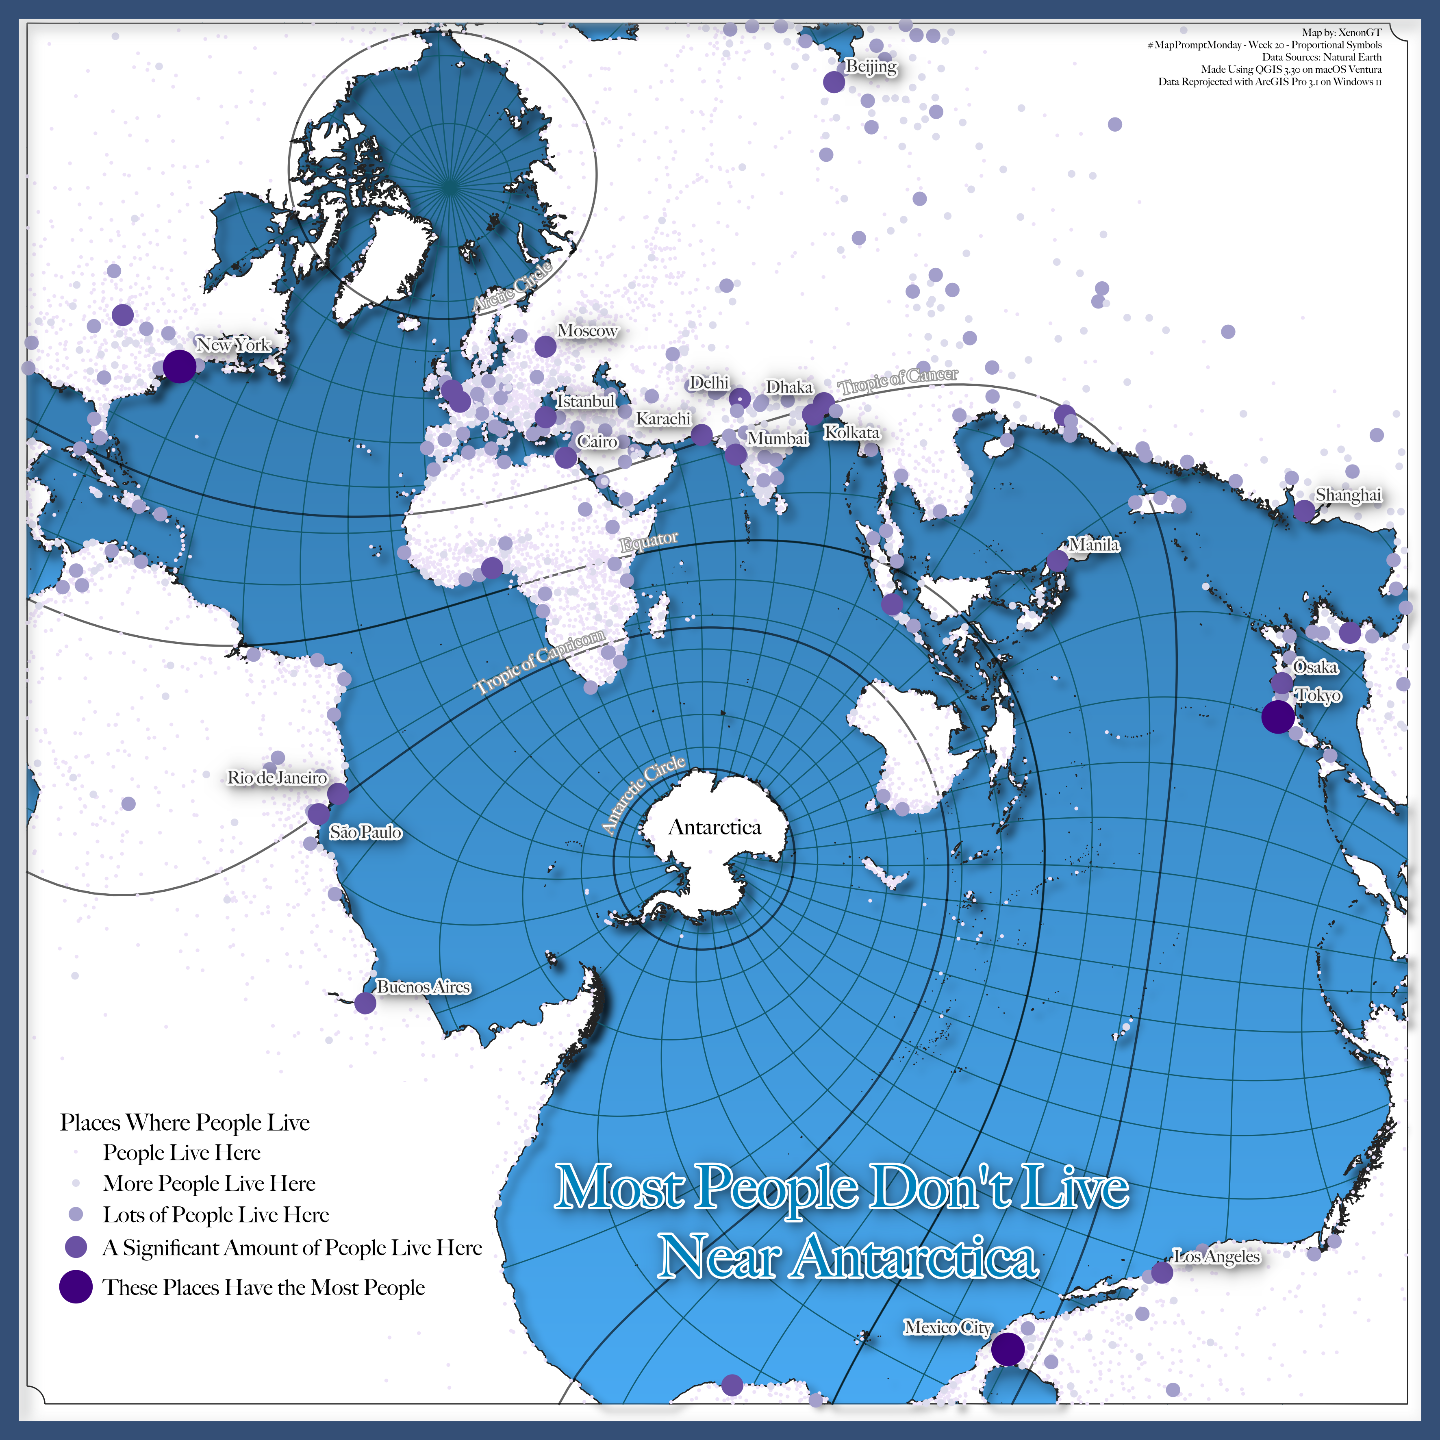
Week of May 15-21 of #MapPromptMonday, Proportional Symbols
Code: https://github.com/gkaramanis/mappromptmonday/tree/master/2023/2023-week_20
#dataviz #rstats #mappromptmonday
Sandon Lettieri · @XenonGT
11 followers · 8 posts · Server mapstodon.space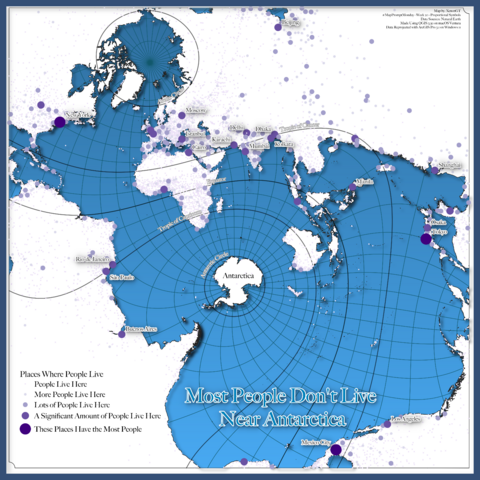
#MapPromptMonday - Week 20 - Proportional Symbols. Decided to make a map of places using proportional symbols for population. That said, I wanted to also try and use the #spilhaus projection within #qgis. While it doesn't seem that data can be transformed into Spilhaus within QGIS, it can be used if it's already in that projection. I reprojected the data in #ArcGISPro and then made my map in QGIS. Like all maps I post online, it's made for fun and my entertainment only. 🙂
#mappromptmonday #spilhaus #qgis #arcgispro
Georgios Karamanis · @georgios
351 followers · 65 posts · Server vis.social
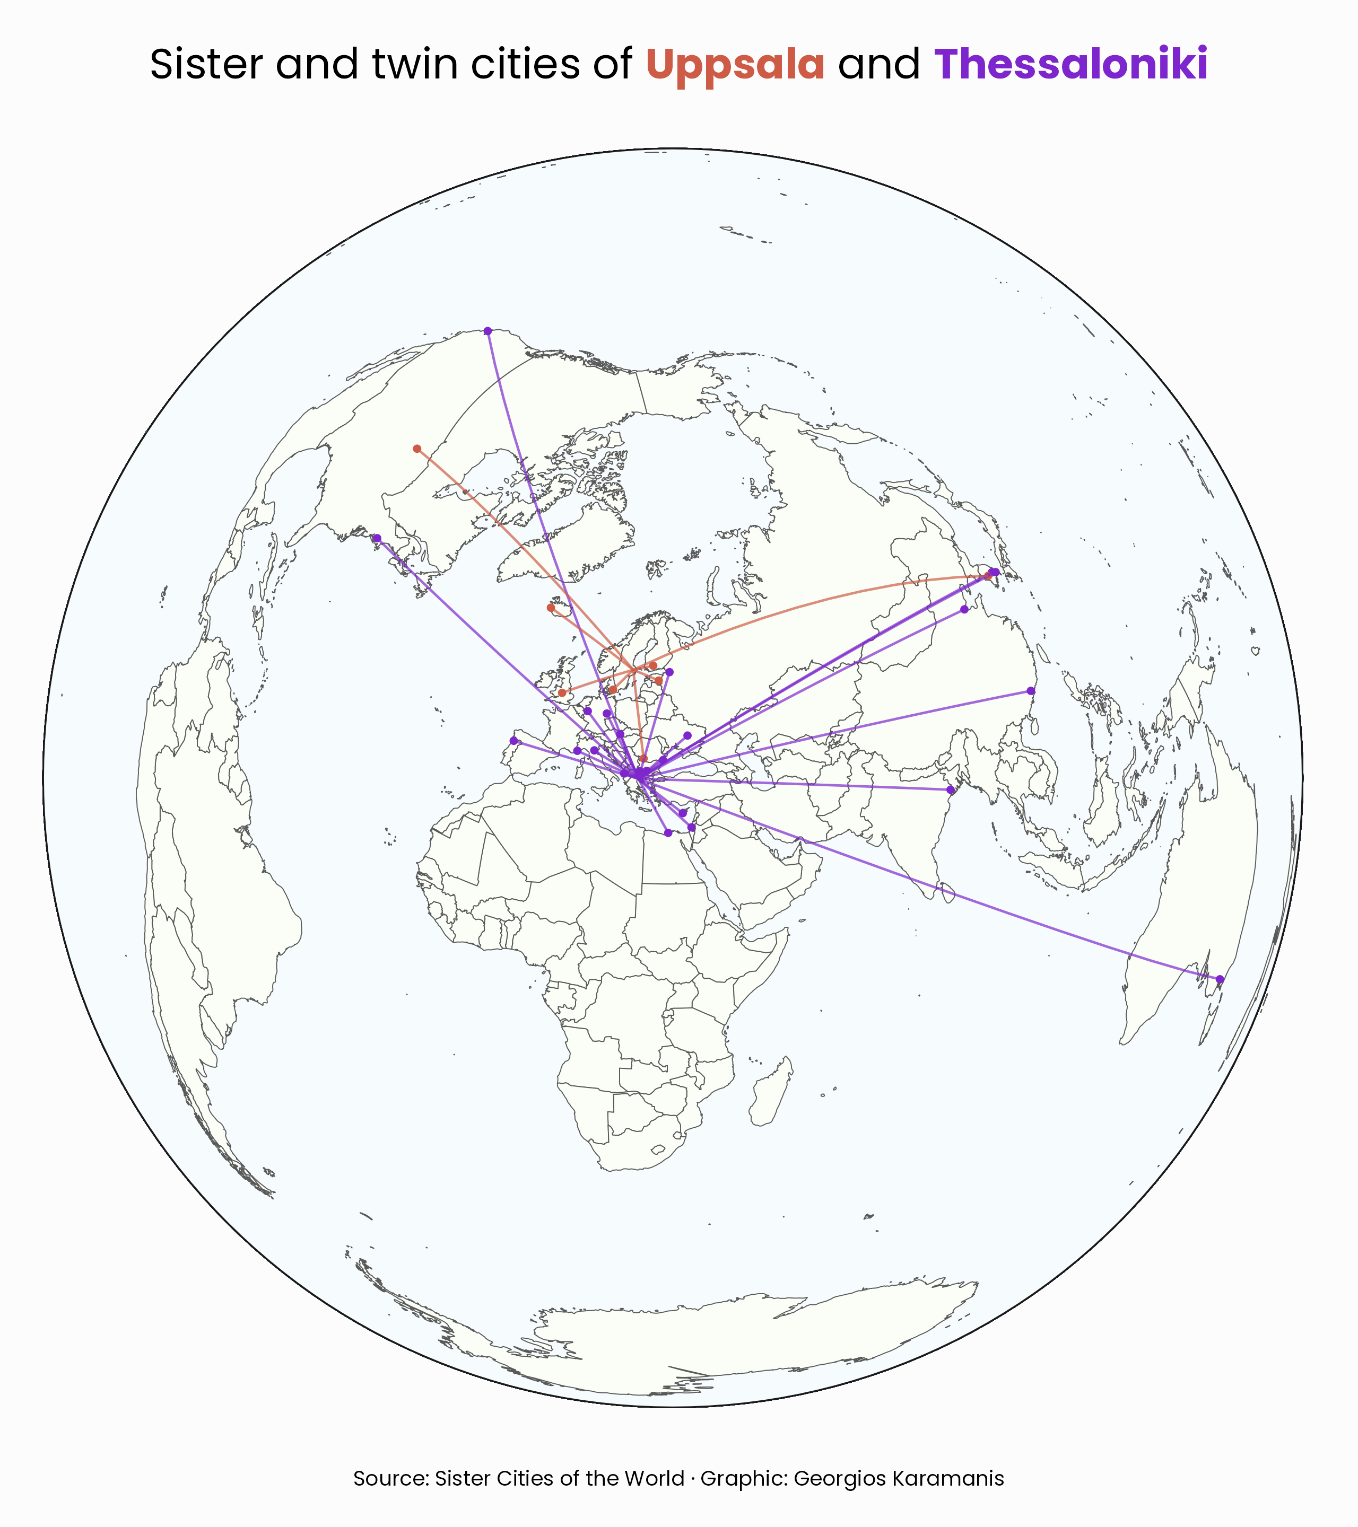
Week 8-14 May of #MapPromptMonday, Home
Sister and twin cities of Thessaloniki and Uppsala, the two cities I call home
Code: https://github.com/gkaramanis/mappromptmonday/tree/master/2023/2023-week_19
#dataviz #rstats #mappromptmonday

Antonio · @aasmith
16 followers · 16 posts · Server mapstodon.space
A very very late #MapPromptMonday Week 8 entry! The theme was grayscale, and I struggled to come up with a different way to show this data outside of a typical choropleth. Once grad school got underway, I had to set it to the side.
The joy plot shows churches per 100k population.
Tools: ArcGIS Pro, Photoshop, Affinity Designer
#mappromptmonday #GIS #gischat #cartography #mapping
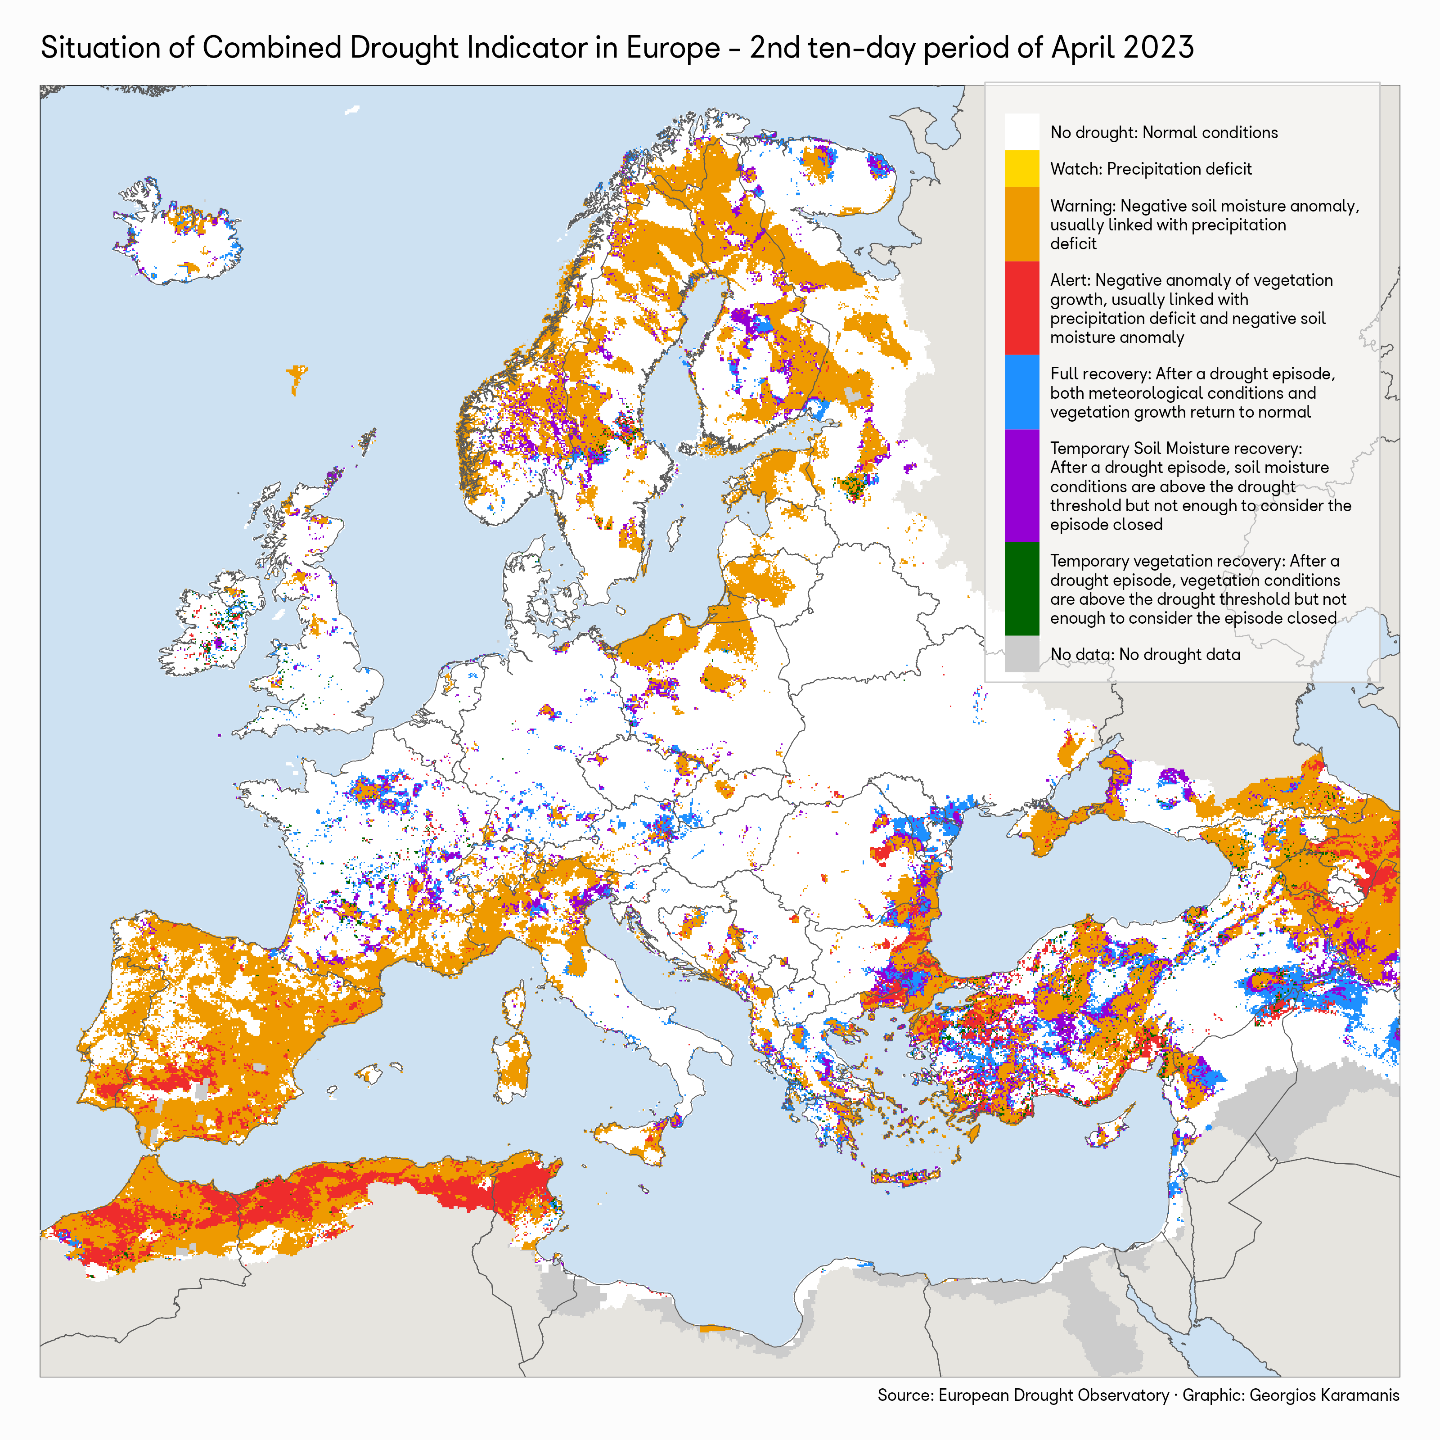
Georgios Karamanis · @georgios
345 followers · 61 posts · Server vis.social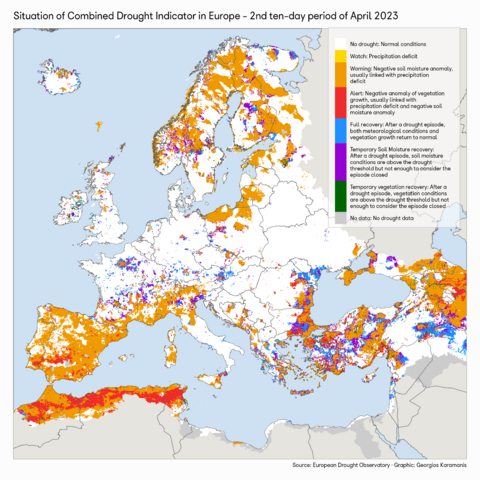
For the week 17-24 Apr of #MapPromptMonday, Environment, I recreated the drought map by Copernicus EMS: https://edo.jrc.ec.europa.eu/edov2/php/index.php?id=1000
Code: https://github.com/gkaramanis/mappromptmonday/tree/master/2023/2023-week_16
#dataviz #rstats #mappromptmonday

Jérémy Garniaux · @jeremy
1594 followers · 1743 posts · Server mapstodon.space
Georgios Karamanis · @georgios
344 followers · 60 posts · Server vis.social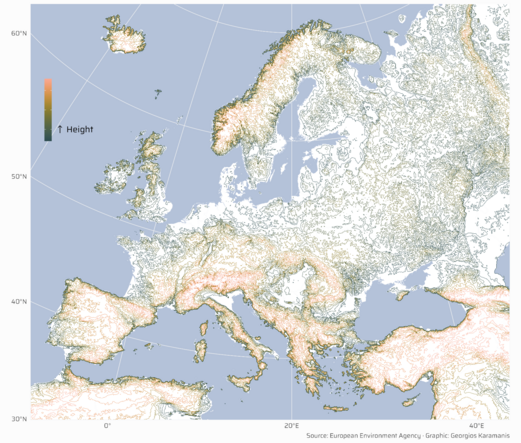
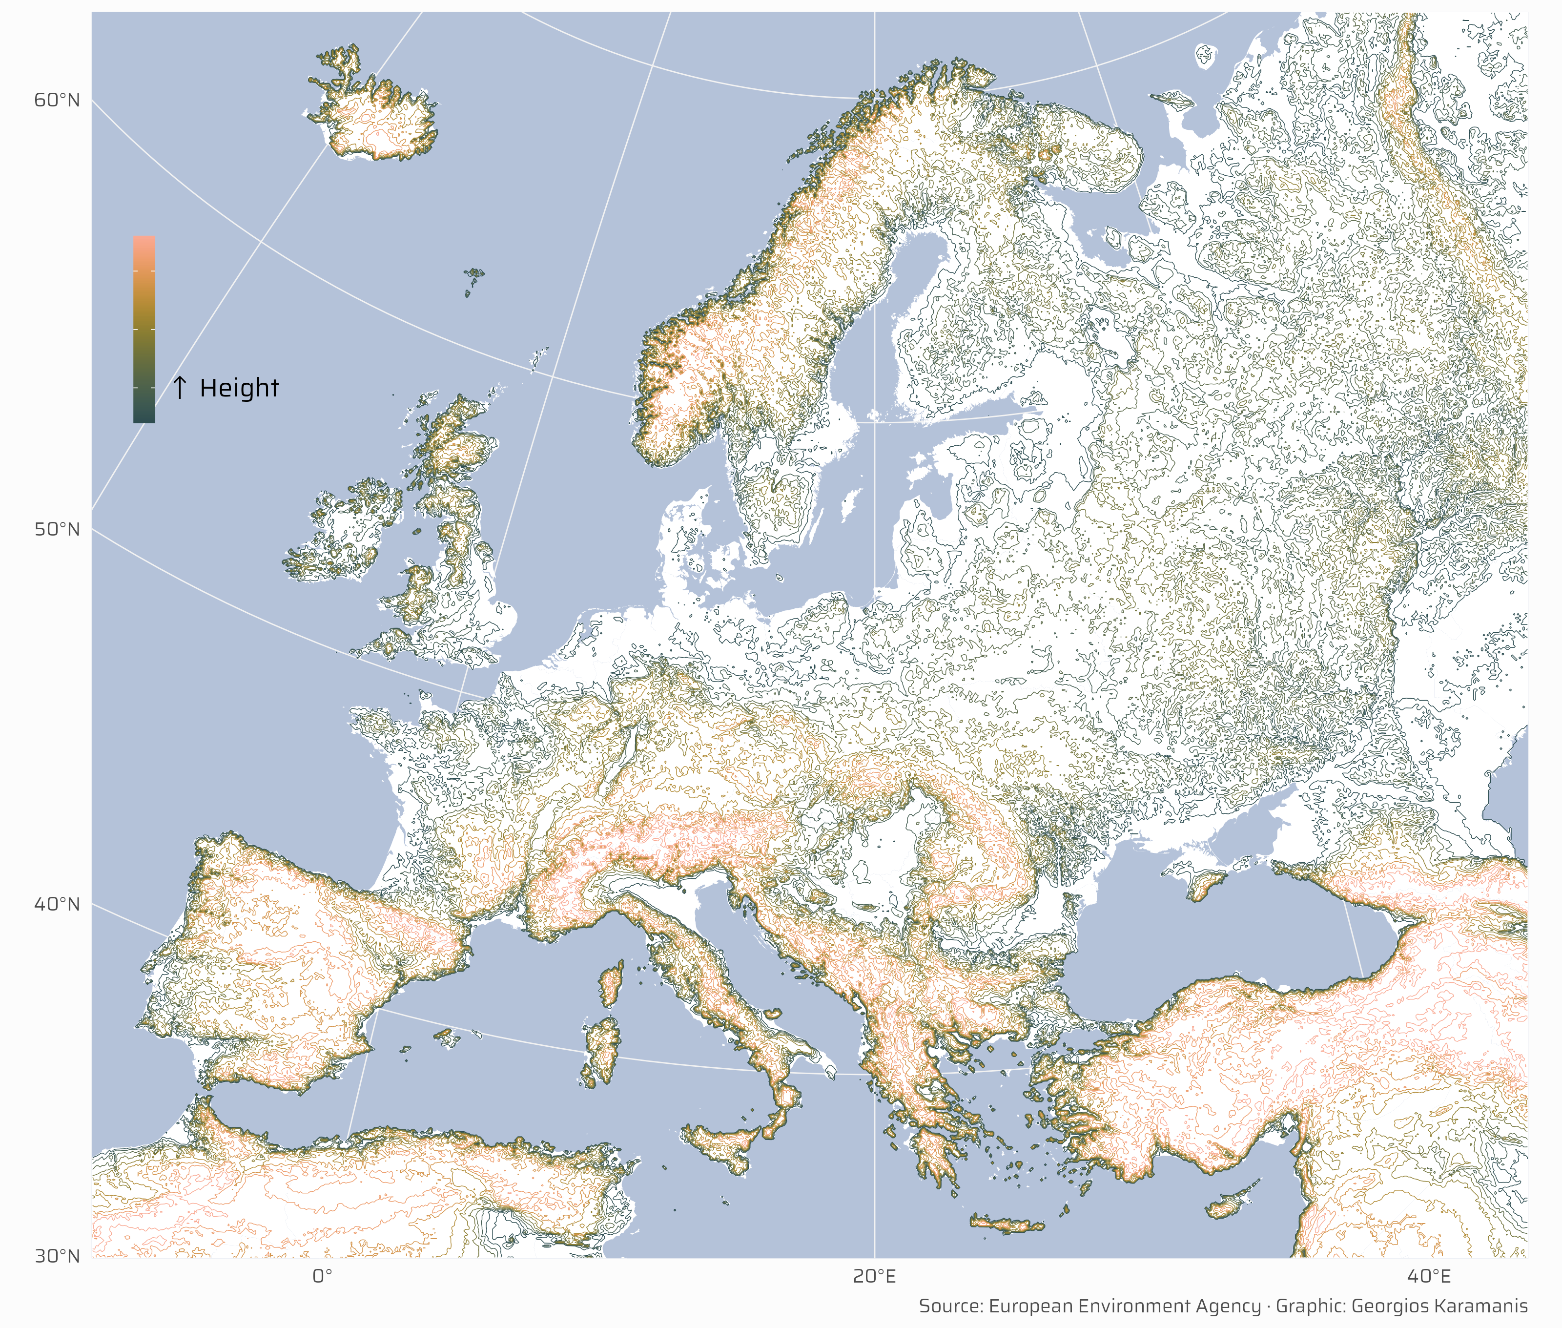
Submission to last week's #MapPromptMonday, Topography
Code: https://github.com/gkaramanis/mappromptmonday/tree/master/2023/2023-week_15
#dataviz #rstats #mappromptmonday