
Tuomas Väisänen 📼🧟♂️ · @waeiski
685 followers · 954 posts · Server vis.socialOk, there is a #python #DataViz issue regarding point pattern analysis my colleagues are struggling with.
It seems that #Seaborn "stretches" two-dimensional #KDE plots in a weird way with some #geopandas data, whereas running the same analysis in #QGIS with the exact same data provides good and expected results.
One option would be to go full #matplotlib to see if it is related to contour plots, but I have not gone there yet.
#matplotlib #qgis #geopandas #kde #seaborn #dataviz #python

Lisa Hornung · @LisaHornung
553 followers · 181 posts · Server fosstodon.org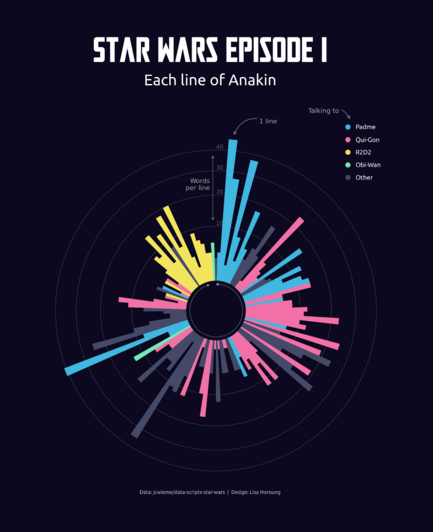
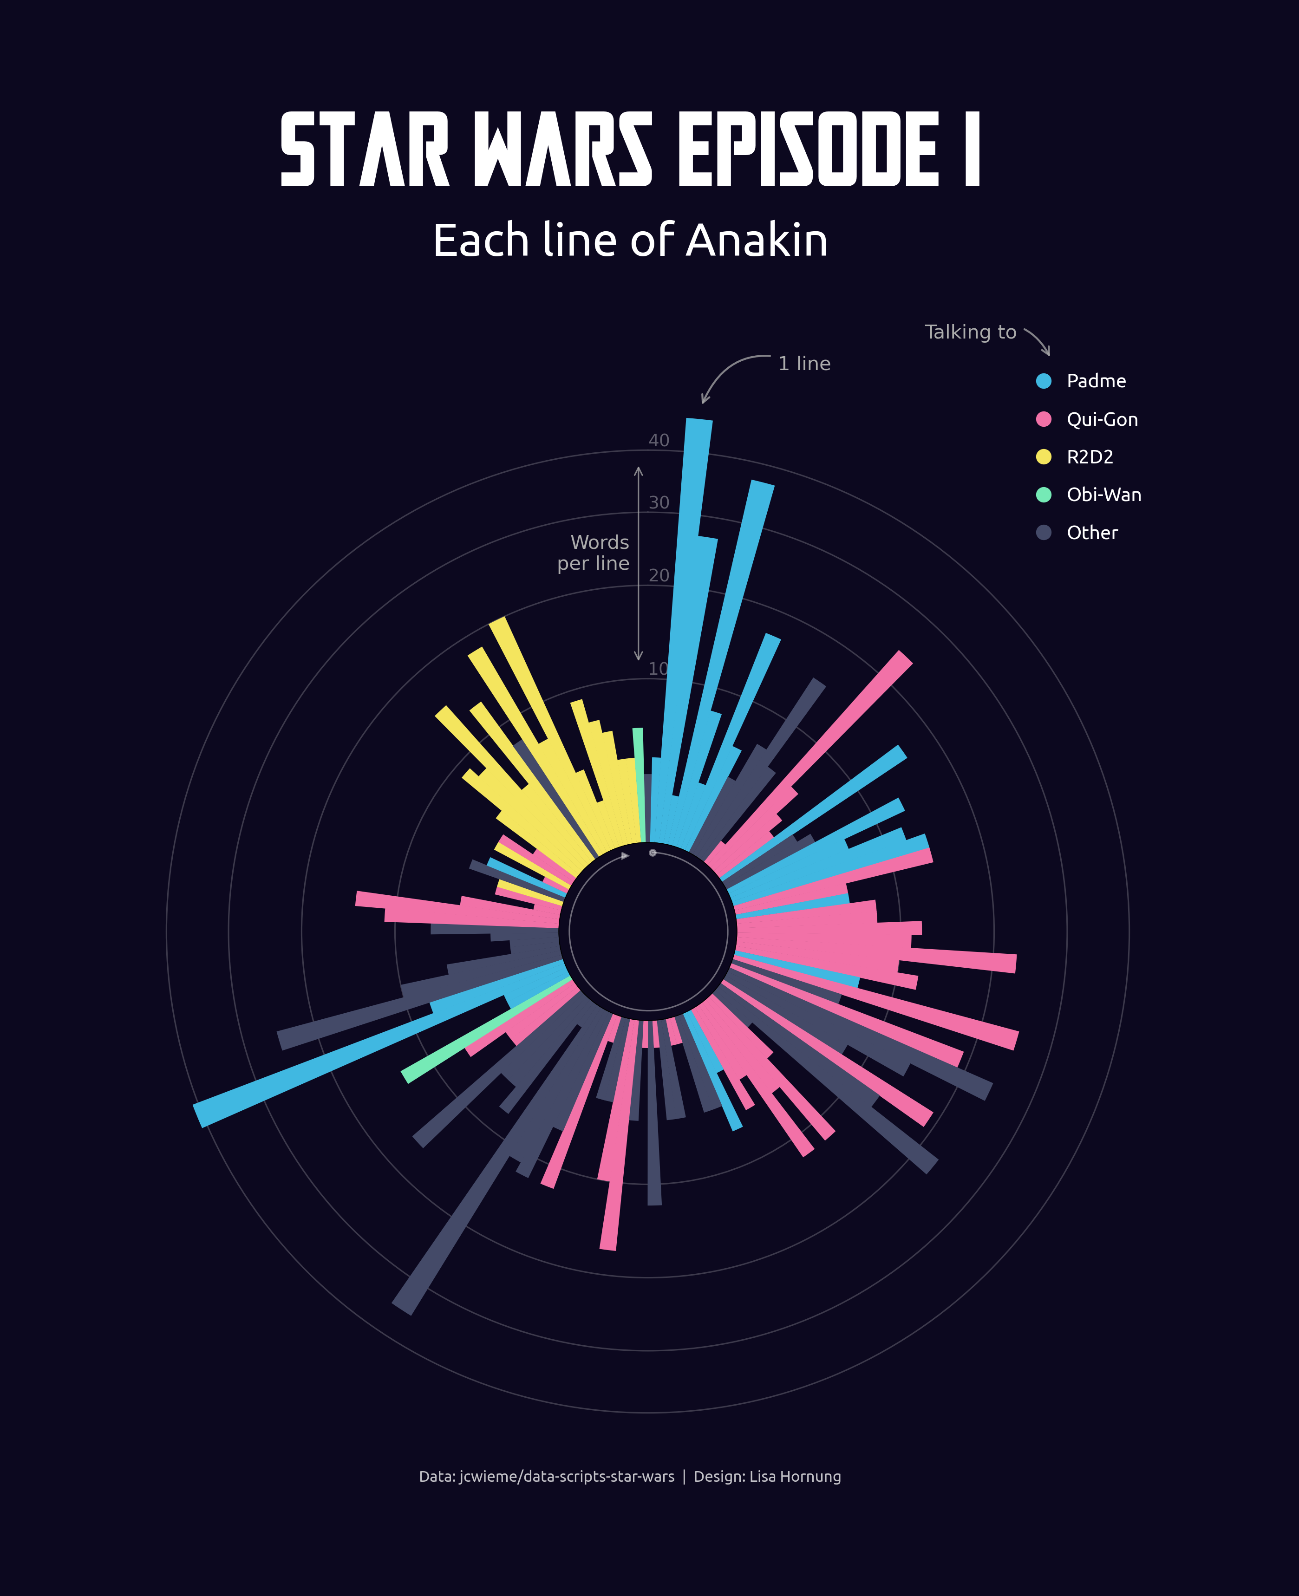
Discovered a gold mine of data from Star Wars scripts for #dataviz projects. Decided to plot each line of Anakin in The Phantom Menace. 🎇
Massive kudos to Jean Wieme for cleaning, checking and providing all the data. 🤩 Available to download here https://github.com/jcwieme/data-scripts-star-wars
Can’t wait to keep exploring the data and viz away!
Polar chart made in #python using #matplotlib, full code here: https://github.com/Lisa-Ho/small-data-projects/blob/main/README.md#082023-star-wars-scripts---each-line-of-anakin-episode-1
#dataviz #python #matplotlib #starwars #datavis #creativecoding

Nicolas P. Rougier · @rougier
632 followers · 352 posts · Server toot.aquilenet.fr
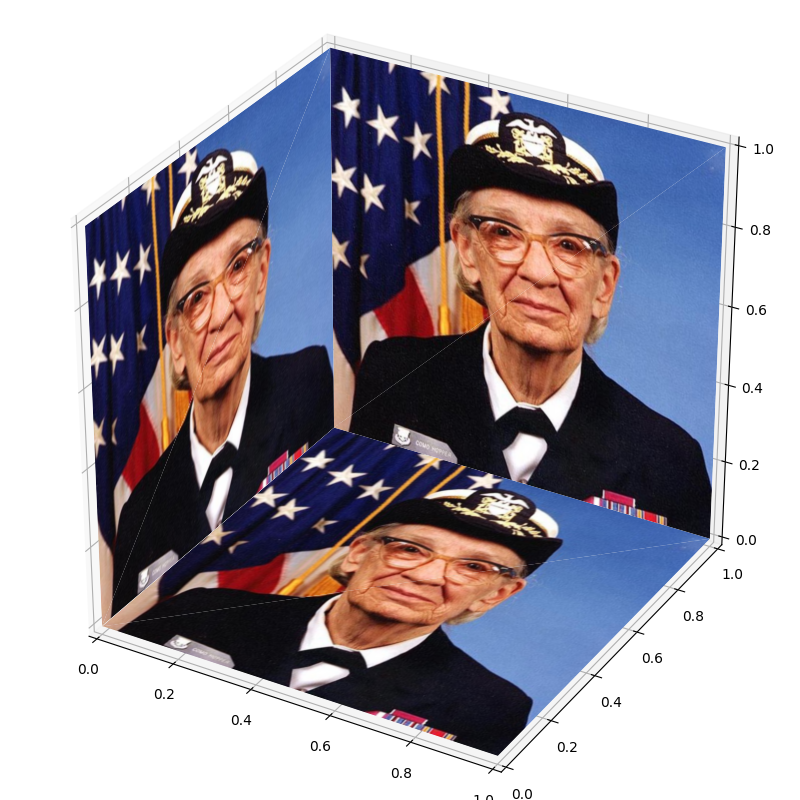
Playing with transform and clip path, I made a 3D imshow for #matplotlib. It is reasonably fast.
Code at https://gist.github.com/rougier/9d5655e4d435d6c0e3ec6372ffcd81f8

@gmgall NFLizado das ideias 🏈 · @gmgall
239 followers · 2782 posts · Server ursal.zone

Alexandre B A Villares · @villares
19 followers · 27 posts · Server pynews.com.br
#Python #matplotlib explorando dados © contribuidores do #OpenStreetMaps
#python #matplotlib #openstreetmaps

Sam Harrison · @samharrison7
158 followers · 194 posts · Server mas.to
#Python is now officially supported in #Excel!
As much as I like to pretend that I dislike anything #Microsoft related (except VS Code, of course), I often find myself turning to Excel for small tasks, particularly when collaborating with non-coder colleagues. This new Python support, in particular the ability to represent ranges of Excel cells as #Pandas DataFrames, and use #Matplotlib and #Seaborn for plotting, could be a game change for these applications.
#seaborn #matplotlib #pandas #Microsoft #excel #Python
Nicolas P. Rougier · @rougier
630 followers · 342 posts · Server toot.aquilenet.fr
Rendering of a 3D textured mesh using #matplotlib only. I didn't think it was possible but it is obviously. A bit slow (~500ms) but mesh can be then saved as PDF and included in article.
Hack is to use several imshow (one per triangle) with transform and clip paths.
Code will be available soon at https://github.com/rougier/gsp-matplotlib

ottoto · @ottoto2017
129 followers · 1912 posts · Server prattohome.com
「 #マイクロソフト 、 #Excel での #Python スクリプトを予告」: The Register
「本日、Excel での Python のパブリック プレビューをご紹介できることをうれしく思います。これにより、Python と Excel の分析を同じ Excel グリッド内に統合して、中断のないワークフローを実現できるようになります」
「Microsoft は #Anaconda と提携し、 #Pandas や #Matplotlib などの人気ライブラリを含むデータ サイエンス指向の Python ディストリビューションを提供しています」
https://www.theregister.com/2023/08/22/python_excel_anaconda/
#マイクロソフト #excel #python #anaconda #pandas #matplotlib #prattohome
@gmgall NFLizado das ideias 🏈 · @gmgall
234 followers · 2673 posts · Server ursal.zoneÉ, olhei hoje de novo e o bruto do tempo de execução nem é gasto em código #Python.
É gasto pelo #ffmpeg que o método matplotlib.animation.FuncAnimation.save() usa para escrever a animação no disco.
Não se gasta muito tempo em loops ou criando/destruindo objetos.
Vou ter que mergulhar na documentação do matplotlib para ver se eles estão usando as classes/métodos ideais para o que estão tentando fazer.
#python #ffmpeg #dev #matplotlib

Tim Kellogg · @kellogh
934 followers · 3430 posts · Server hachyderm.io
oh wow! You'll be able to use #python from within #excel and #powerquery soon. And that Python install includes #pandas, #matplotlib and #statsmodels https://www.theverge.com/2023/8/22/23841167/microsoft-excel-python-integration-support
#python #excel #PowerQuery #pandas #matplotlib #Statsmodels
@gmgall NFLizado das ideias 🏈 · @gmgall
233 followers · 2671 posts · Server ursal.zonePediram para eu melhorar o desempenho de um código #Python que gera uma animação com #matplotlib
Usei um profiler para ver que linhas do código gastavam mais tempo.
Parece que a maior parte do tempo é gasto *numa única chamada* a
animation.FuncAnimation.save() que por sua vez usa ffmpeg quase todo o tempo.
Vou confirmar os tempos amanhã, sem sono, mas parece que é isso mesmo. Aceito sugestões.

Abhinav Tushar · @lepisma
3 followers · 13 posts · Server mathstodon.xyzI made a little tool to abstract away #Matplotlib with natural language instructions.
https://lepisma.xyz/2023/08/20/matplotllm:-an-llm-assisted-data-visualization-framework/index.html

EvgenyNr · @evgenynr
7 followers · 124 posts · Server toot.ioПочему мне нравится #plotly, и не так нравится #matplotlib?
1. Plotly имеет функциональный интерфейс и не приходится иметь дело с ненавистным глабальным состоянием, провоцирующим крышесносные ошибки в matplotlib (например в matplotlib можно случайно вызвать `clf()` до создания `figure()` с непредсказуемым поведением 🤪)
@ru
#plotly #matplotlib #plotlypotbot #dataviz #science #functionalprogramming

Jan Kühn · @yotka
23 followers · 23 posts · Server vis.social
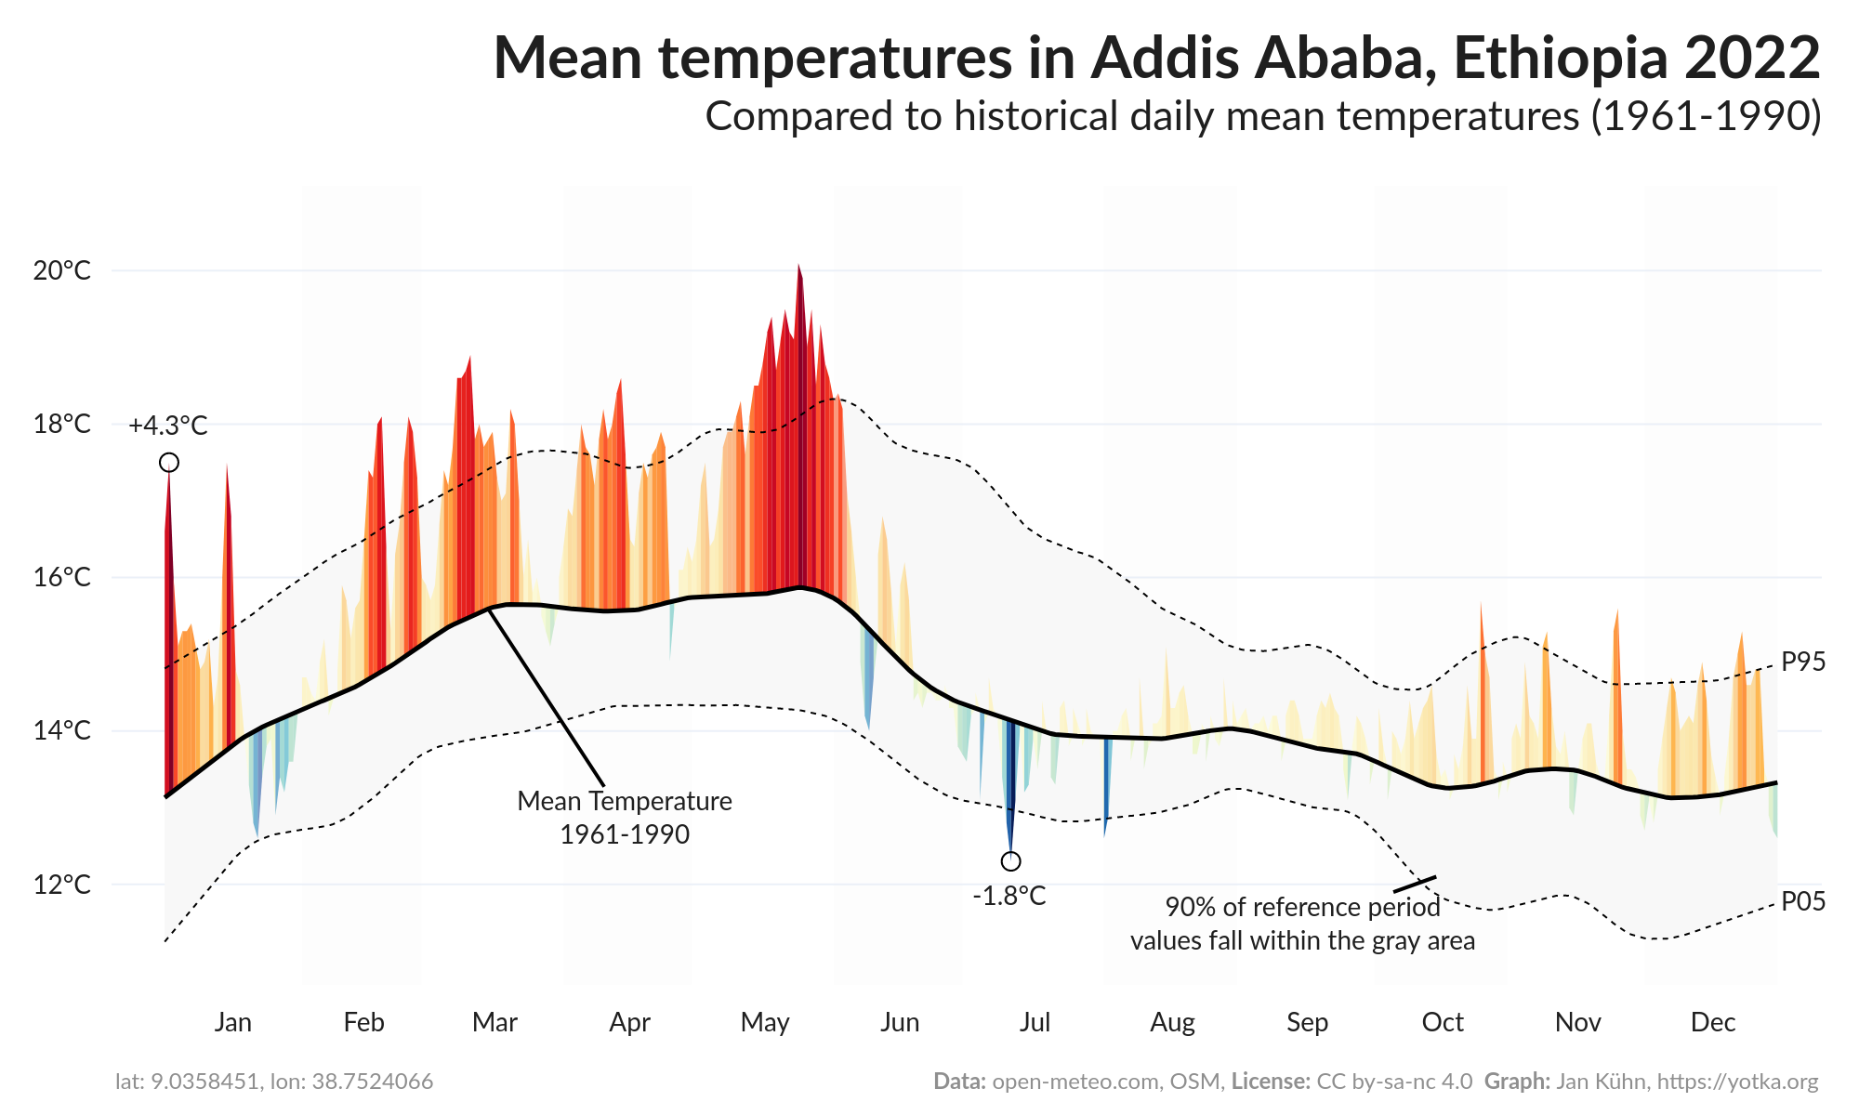
Still, you can download the plot as a static PNG image. For smaller screens, a static version is displayed automatically.
The latest version has seen some major refactoring and now uses #Plotly instead of #Matplotlib. The data comes, as before, from @openmeteo .

Giovanni Crisalfi · @gicrisf
85 followers · 282 posts · Server fosstodon.orgAs promised, I have published the second episode of the introductory tutorial on Hy, the Lisp dialect that compiles to Python AST and interoperates with its libraries.
This episode explores lexical scoped blocks and macros, showcasing the metaprogramming capabilities offered by Hy.
https://dev.to/gicrisf/getting-started-with-hy-the-python-lisp-a-matplotlib-example-ep-2-7jm
#hylang #python #beginner #lisp #clojure #macro #matplotlib

Stark · @Stark9837
485 followers · 2536 posts · Server techhub.socialFor research projects where I use #NumPy and #MatPlotLib, I actually like using #Jupyter! It is just easier to run code and view my plots.
With #PyQt, you can even have widgets like sliders and other #Qt stuff.
It just speeds up my prototyping and makes me more productive. Naturally, only my plotting code and math exist in the .ipynb, and the rest is just imported from normal .py files. Thus, it allows for quick conversions once the prototyping is done.
#numpy #matplotlib #jupyter #pyqt #qt #python

Anita Graser 🇪🇺🇺🇦 · @underdarkGIS
2494 followers · 1908 posts · Server fosstodon.org
TIL more about #holoviews / #colorcet / #bokeh / #matplotlib color map handling than I ever wanted to know 🤨
Hopefully, the improved #movingpandas plots will be ready soon
#holoviews #colorcet #bokeh #matplotlib #movingpandas #dataviz #mobilitydatascience #movementdataanalytics

Yann Büchau :python: · @nobodyinperson
230 followers · 982 posts · Server fosstodon.orgInteresting how resizing an interactive (%matplotlib widget) #matplotlib plot in @Jupyter #JupyterHub can deadlock :firefox: #Firefox so hard, that you can't kill -9 it anymore, thus have to reboot and watch systemd being unable to properly shut down due to this, so effectively a hard-reboot is necessary 🤦
#matplotlib #jupyterhub #firefox

Boud · @boud
394 followers · 2251 posts · Server framapiaf.org#Matplotlib question for scientific graphs:
How can I get standard scientific notation (e.g. 3.4 \times 10^{-5} converted #TeXLaTeX style, at a tick) on axis labels instead of the software style '10e-5' written near the axis and 3.4 at the tick? Readers of a paper are not necessarily matplotlib fans.
pyplot.loglog() does this, but not all plots make sense as log-log plots.
#Searx searches so far only turn up hints for software 'e' notation, not standard notation.
Yann Büchau :python: · @nobodyinperson
229 followers · 951 posts · Server fosstodon.orgOooh, this is starting to look very promising! With a shell.nix file, a Pipfile[.lock] (all in #git of course) I was able to reproduce the same environment across multiple machines. And even my pickled and compressed #Matplotlib figures created on one machine opened fine on the other (very delicate matter normally). 🥳