
Jan Kühn · @yotka
24 followers · 28 posts · Server vis.social
Now that's good news: The plot I created for my #MeteoHist app is featured in the "Best Python Chart Examples" of Yan Holtz's Python Graph Gallery:
https://python-graph-gallery.com/best-python-chart-examples/
Yan invited me to showcase my work and of course I accepted - thanks a lot! #dataviz
Jan Kühn · @yotka
23 followers · 23 posts · Server vis.socialGoing interactive with my #MeteoHist web app!
I published a new version which allows you to interactively inspect the graphs it produces, zoom in and out and and show values for each day.
Here you can play with it: https://yotka.org/meteo-hist/
#opendata #globalwarming #heatwave #climatecrisis #dataviz #meteohist
Jan Kühn · @yotka
23 followers · 23 posts · Server vis.socialThe #MeteoHist app has many new features:
- Search by lat/lon coordinates
- See date of the last data point included
- Share graphs via URL
- Change units to use Fahrenheit/Inches
- Months have an alternating background
- Historical data is smoothed using LOESS
Here you can try the app: https://yotka.org/meteo-hist
If you find bugs or have suggestions, feel free to open an issue on GitHub:
https://github.com/yotkadata/meteo_hist
Jan Kühn · @yotka
13 followers · 9 posts · Server vis.social
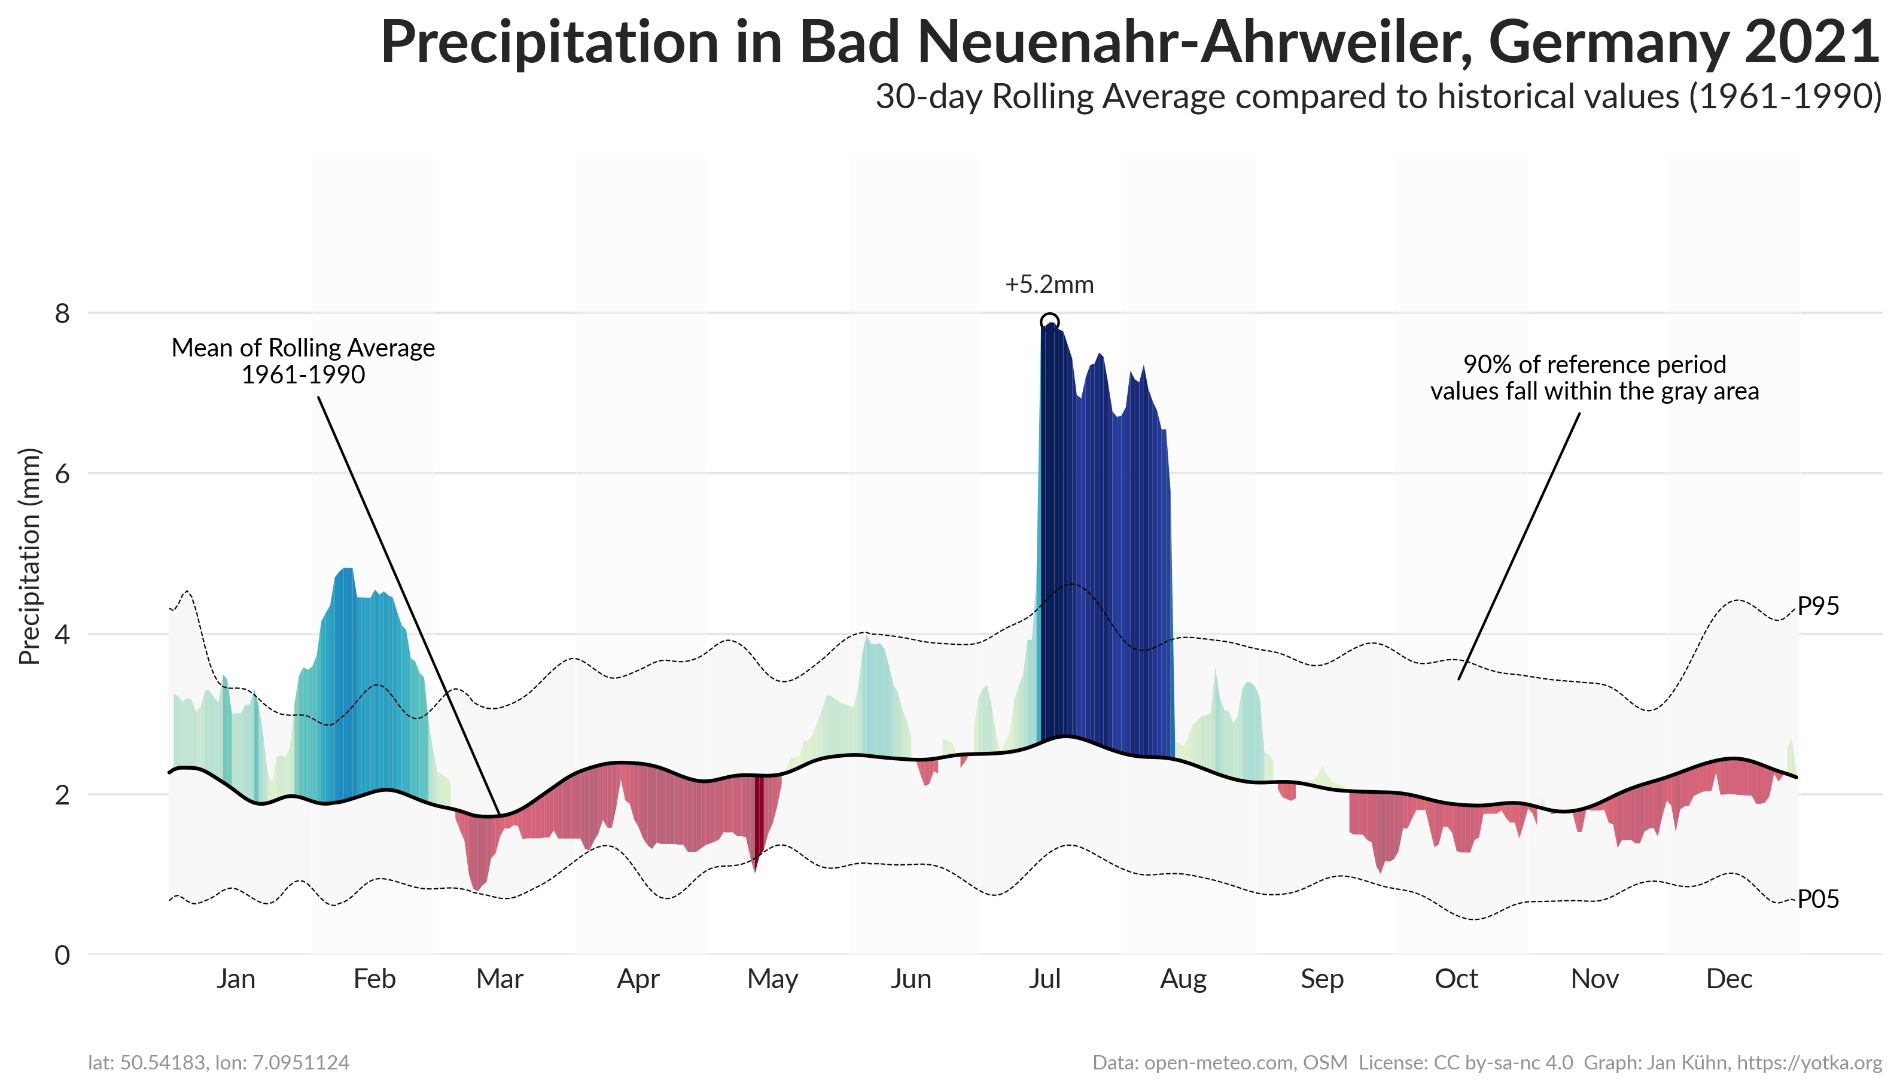
I updated my #MeteoHist App. You can now also create graphs for precipitation, both with cumulated values and a 30-day rolling average. For the latter, see an example below. It shows precipitation in #Ahrweiler, Germany which was hit by a #flood catastrophe in 2021. #dataviz
#dataviz #flood #Ahrweiler #meteohist
Robert-Jan Wille · @RobertJanW
123 followers · 6 posts · Server mastodon.socialShout out to everyone of #histodons on the crossroads of #envhist, #envhum and #histstm #meteohist
#histodons #envhist #envhum #histstm #meteohist