Adam C Smith bird trends · @AdamClarkSmith
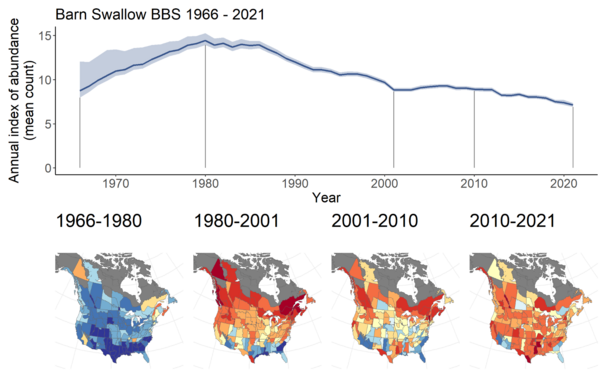
80 followers · 115 posts · Server fediscience.orgSpatial and temporal patterns in population change for Barn Swallow, from the North American Breeding Bird Survey #NABBS.
Increasing across most of its range until the early 1980s. Since then decreasing and most strongly in the north.
This change-point in the 1980s is common for most species of swallows, swifts, and nightjars in North America.
Adam C Smith bird trends · @AdamClarkSmith
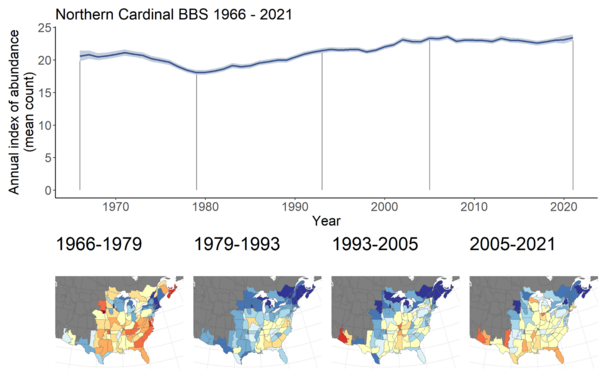
78 followers · 109 posts · Server fediscience.orgNorthern Cardinals decreased until 1979, then increased until 2005 and have been stable since the (blue on map = increase, red = decrease). The increases have been at the northern and western edges of their range, and since 2005, they've been decreasing in the south.
#NABBS #BiologicalMonitoring #Birds #PopulationTrends #NorthernCardinal #NOCA
#noca #northerncardinal #PopulationTrends #birds #biologicalmonitoring #nabbs
Adam C Smith bird trends · @AdamClarkSmith
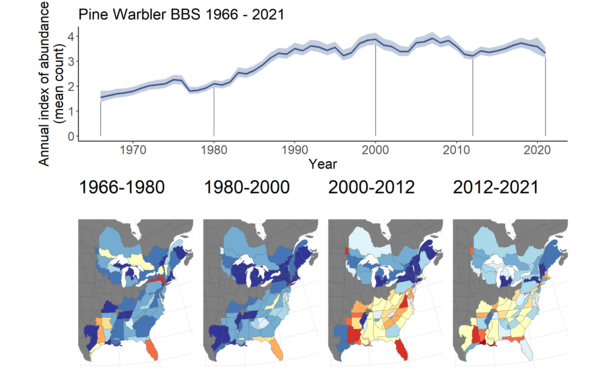
78 followers · 96 posts · Server fediscience.orgPine Warblers increased across their range from 1966 - 2000 (blue regions on maps). Since then they've been fluctuating but overall relatively stable. That survey-wide stability is a composite of decreases in the south (red coloured regions in south) and ongoing increases in the north (blue coloured regions).
#NABBS #BiologicalMonitoring #Birds #PopulationTrends #PineWarbler
#pinewarbler #PopulationTrends #birds #biologicalmonitoring #nabbs
Adam C Smith bird trends · @AdamClarkSmith
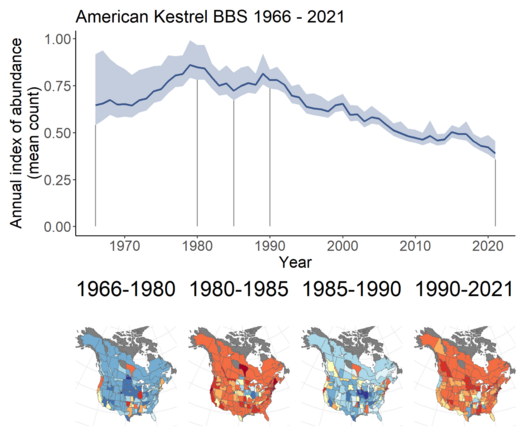
78 followers · 91 posts · Server fediscience.orgHere's another species that provides an interesting contrast:
American Kestrel, apparently cyclical pattern in time that is largely consistent across the species' range.
#AmericanKestrel
#NABBS
#CitizenScience
#BiologicalMonitoring #mcmcStan #birds
#birds #mcmcstan #biologicalmonitoring #citizenscience #nabbs #americankestrel


