
mr_daemon · @mr_daemon
221 followers · 972 posts · Server untrusted.website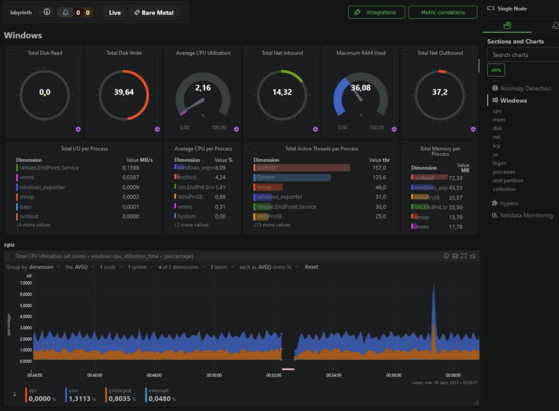
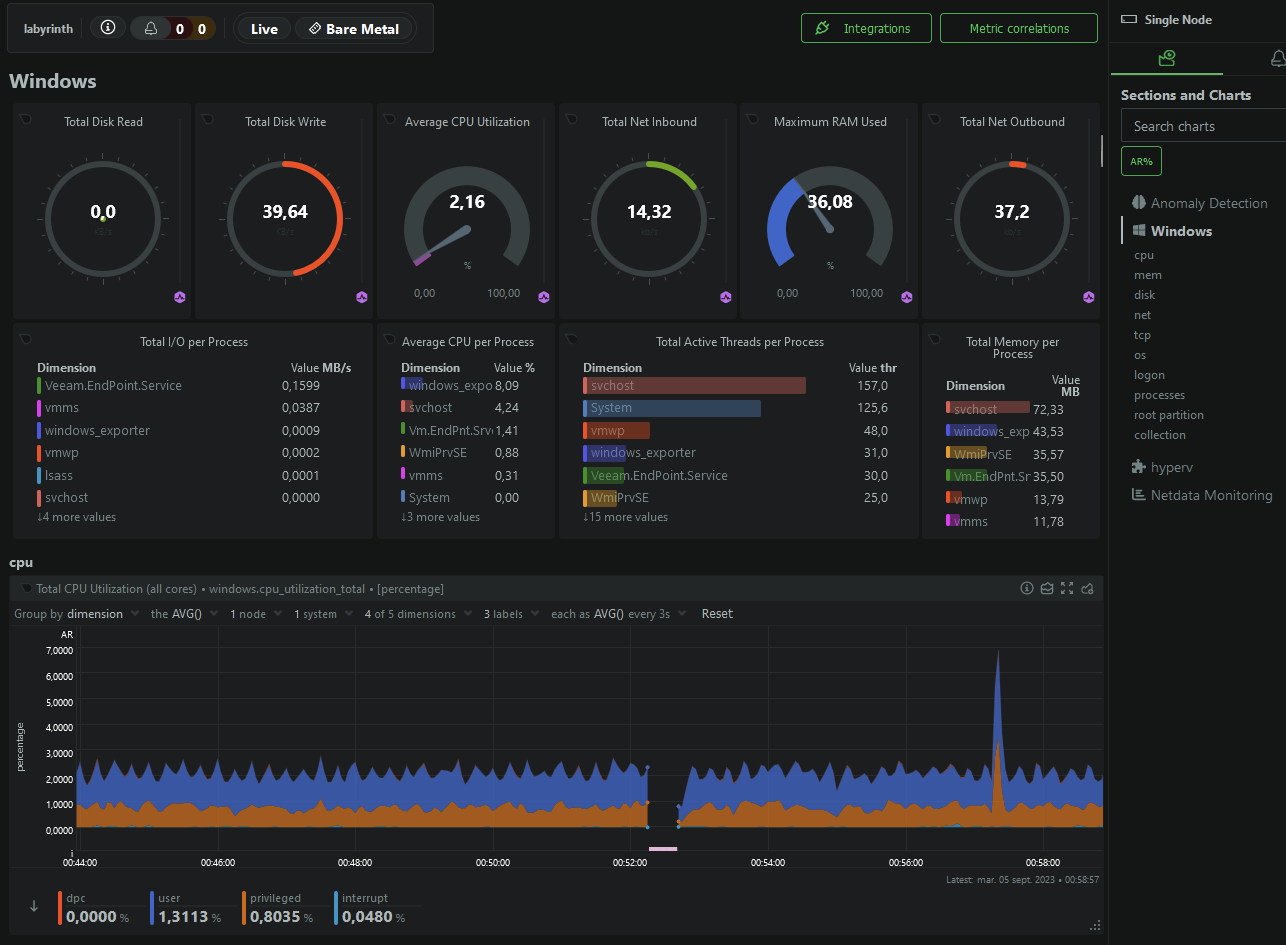
So it turns out you can monitor Windows hosts from Netdata just fine, provided you just use the windows prometheus exporter, and tell another agent on some unix system on the network to fetch that as jobs, and tag them as Virtual Nodes so they show up as their own machine in the dashboard.
It is: a bit cursed, but also nice.
#netdata #windowsserver #cursedcomputing
Abhinav ⁉️ · @abnv
256 followers · 1177 posts · Server fantastic.earthI'm trying to set up #Netdata alerts on #NixOS for https://fantastic.earth but I can't find good documentation or examples of it. Help me out #lazyweb? #MastoAdmin
#netdata #nixos #lazyweb #mastoadmin

ItzTrain :aim_logo: · @train
195 followers · 2230 posts · Server hachyderm.ioI been messing with #prometheus, #grafana and #netdata for the last hour in my #homelab and that shit aint lining up with each other.. I don't trust anything anymore. I'm having Maury situation right now! Who's the fucking father!
#prometheus #grafana #netdata #homelab #selfhosted #observability #selfhosting

Nicolas Cropp :verified_root: · @nicolas
73 followers · 1257 posts · Server social.lol
Okay, this is pretty cool. I added a Netdata dashboard to my Lemmy instance https://apollo.town recently, and I just discovered I can embed little badges into sites with a few metrics.
Now our sidebar shows ping time to other instances so you can see if federation is working OK. Neat!
#Lemmy #lemmy #fediverse #Fediverse #sysadmin #netdata #monitoring #federated
#lemmy #fediverse #sysadmin #netdata #monitoring #federated

Rick · @NanoSector
44 followers · 317 posts · Server social.nanosector.nlLittle "off my chest" post… I wish setting up monitoring for things like SMART and failed systemd services was more straightforward, and each service didn't have its own monitoring configuration…
Currently have #Netdata set up which helps a _ton_ and I can recommend it to anyone, but I have no faith in the amalgamation of scripts and configuration files that is supposed to monitor the dark corners of my server.

ДевоПес · @devops
46 followers · 168 posts · Server twiukraine.com#netdata - дуже потужний та зручний інструмент моніторінгу сервера. Однією командою можна налаштувати сотні графіков та купу метрик:
https://learn.netdata.cloud/docs/installing/docker

Emory L. · @emory
169 followers · 1550 posts · Server soc.kvet.ch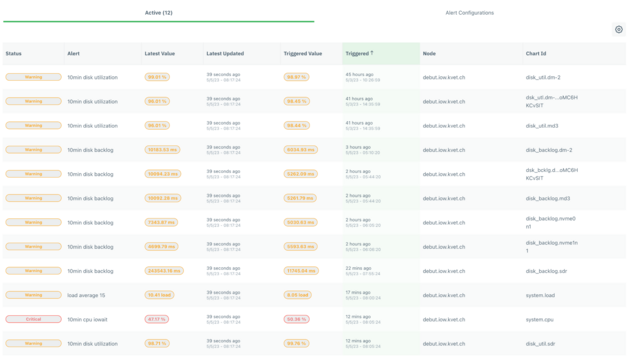
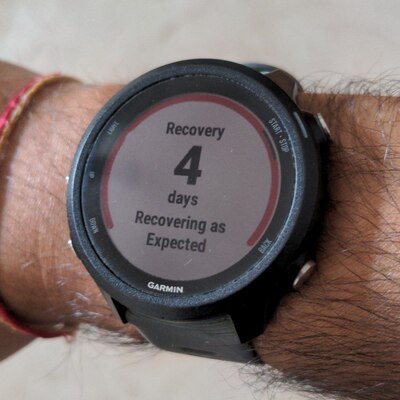
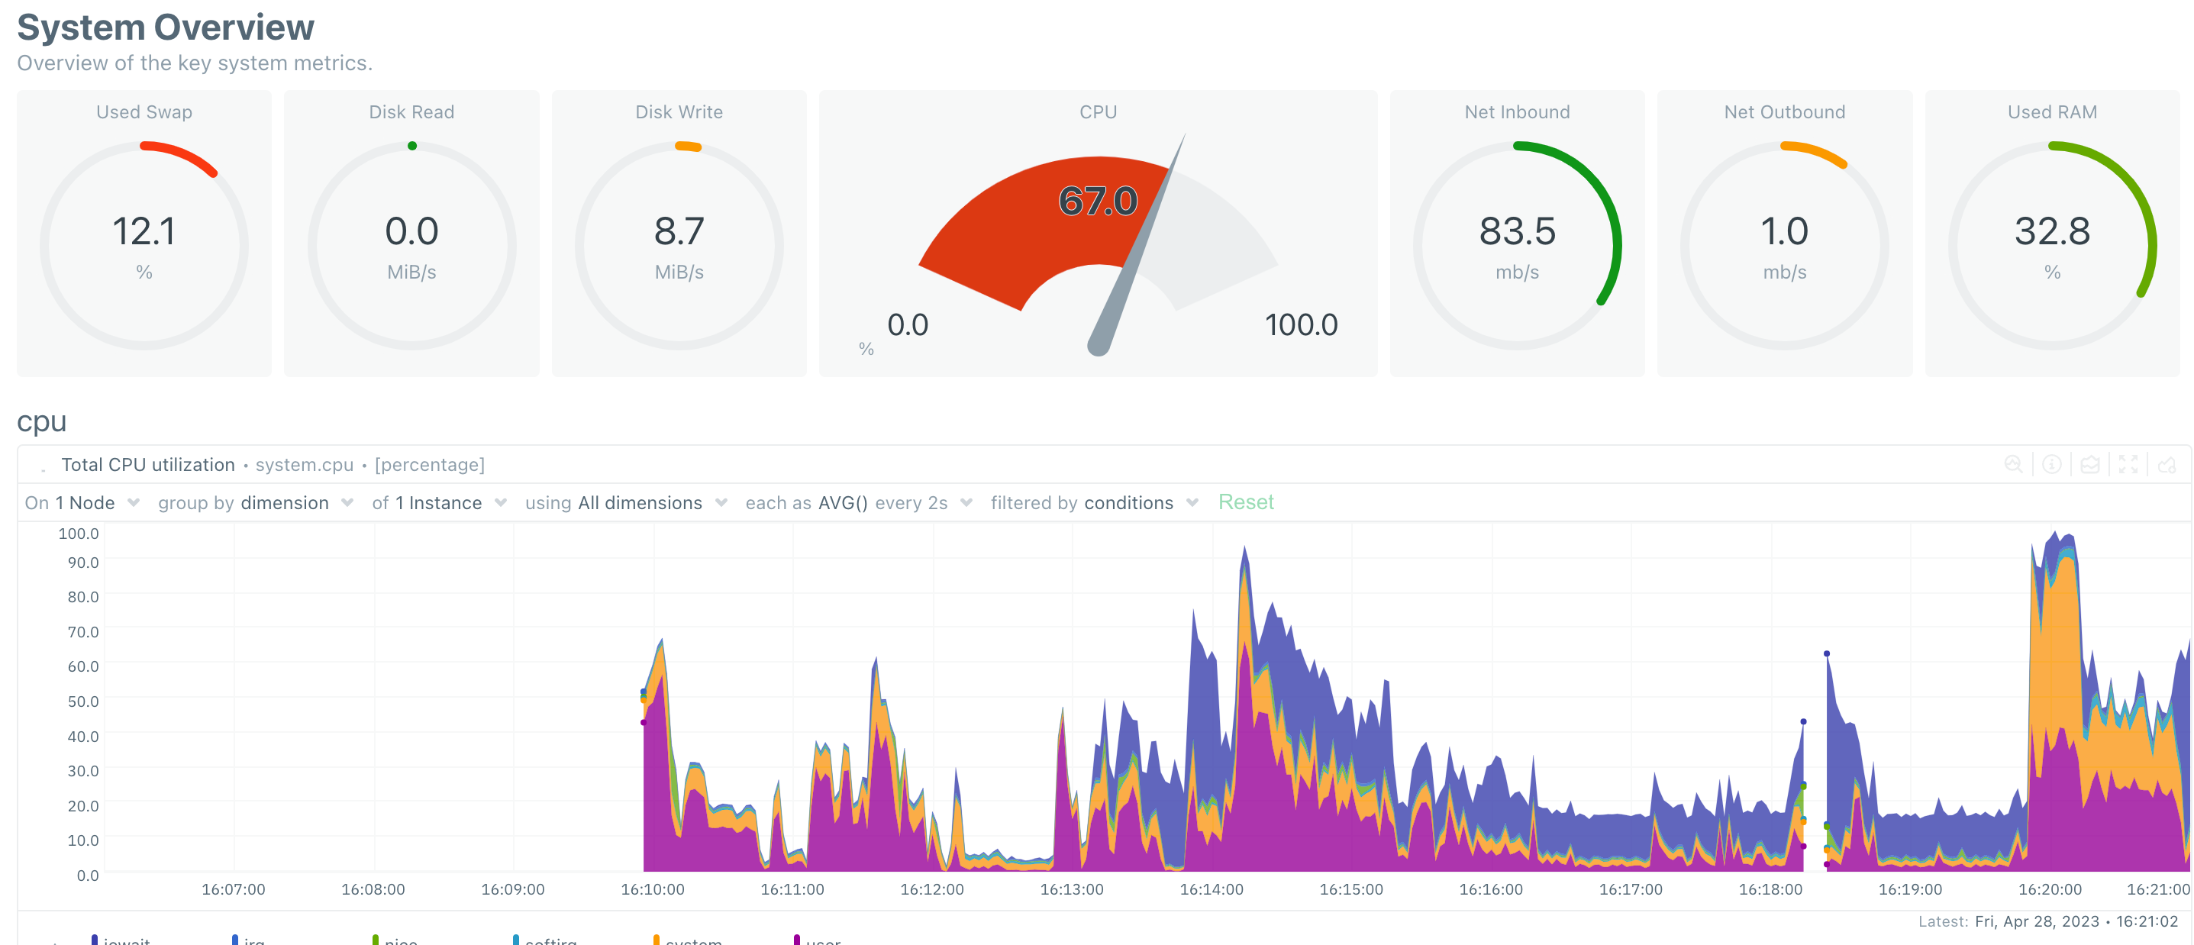
my iowa city homenet has reached the tipping point where optimization and efficiency needs to come into play. i have coasted on brute force to this point. i think i have backup jobs that put my central filer unable to keep up with iops and i wake up to this sort of thing in #netdata #monitoring (p.s. thank you everyone for that netdata tip i love it, even got my #steamDeck reporting in but macOS workstations are tricky and fall away occasionally.
#netdata #monitoring #SteamDeck
Emory L. · @emory
165 followers · 1465 posts · Server soc.kvet.ch
Emory L. · @emory
164 followers · 1414 posts · Server soc.kvet.ch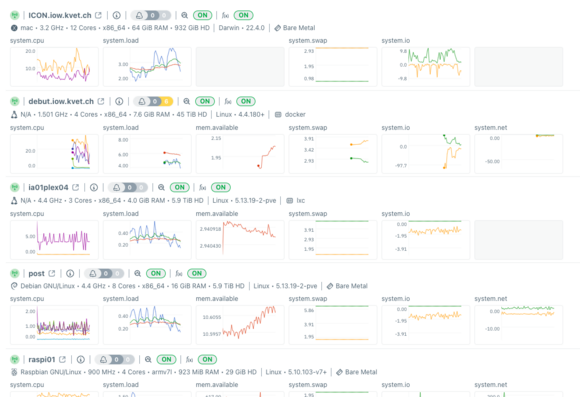
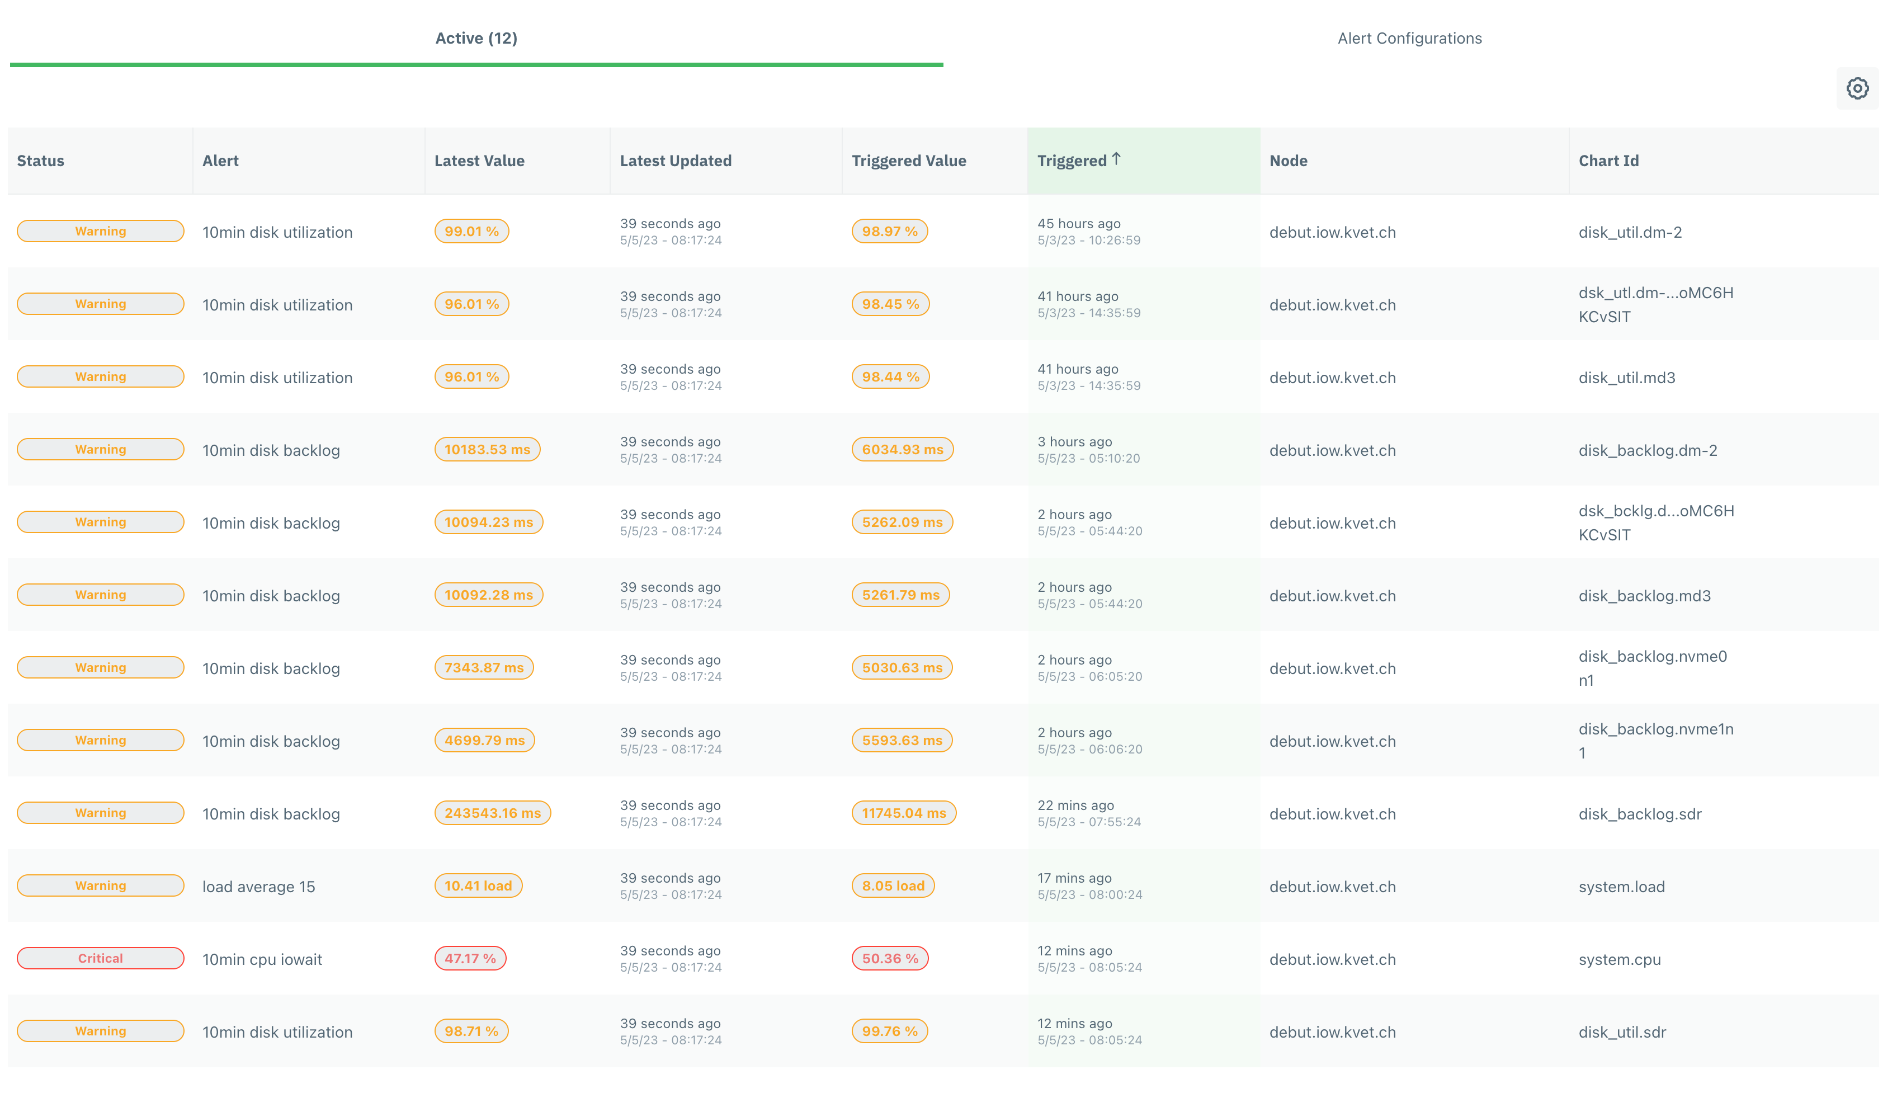
my monitoring project continues and i've deployed #netdata on a synology filer via #docker. i don't know if that will be sufficient to gather the sorts of metrics i am interested in yet but it's in my dashboard.
i see a lot of "data backlog of 10 minutes" alerts that i don't know how to interpret because i have a redundant read/write ssd cache and i find it hard to believe anything is waiting 10+ minutes for anything but i haven't dug in yet.
#netdata #docker #householdIT #dashboards

Ecss 十一 :verify: · @Ecss
9 followers · 199 posts · Server du.capricom.info
☆ joene ☆ · @joenepraat
1296 followers · 23858 posts · Server todon.nlOK, nevermind. I've found the solution. Probably I can not read or it was unclear. I let others to decide. 😉
https://github.com/netdata/netdata-cloud/issues/786#issuecomment-1495592642
Only downside of #Netdata is that they don't have an #Android app. I really would like an app that displays the basic graphs of all my #VPS's. Like CPU, RAM, load, etc. Even better if it has a widget. Unfortunately I could not find an open source app for that. Only a #JuiceSHH add-on (Performance Monitor) that can only display one VPS at a time (this will do for the time being).
Ideas still welcome!
#monitoring #sysadmin #juiceshh #vps #android #netdata
☆ joene ☆ · @joenepraat
1296 followers · 23858 posts · Server todon.nlOK, nevermind. I've found the solution. Probably I can not read or it was unclear. I let others to decide. 😉
https://github.com/netdata/netdata-cloud/issues/786#issuecomment-1495592642
Only downside of #Netdata is that they don't have an Android app. I really would like an app that displays the basic graphs of all my #VPS's. Like CPU, RAM, load, etc. Even better if it has a widget. Unfortunately I could not find an open source app for that. Only a #JuiceSHH add-on (Performance Monitor) that can only display one VPS at a time (this will do for the time being).
Ideas still welcome!
#monitoring #sysadmin #juiceshh #vps #netdata
☆ joene ☆ · @joenepraat
1292 followers · 23794 posts · Server todon.nlSo I'm trying #Netdata, but somehow it doesn't want to listen to me. I disable some warning it needs to ignore, but it still sends me emails and it shows up on app.netdata.cloud. What am I doing wrong?
If you have better alternatives, that are as easy as Netdata, incl. a web-app that you don't need to host yourself, please tell?
#monitoring #server #Linux #sysadmin #netdata

Jan ☕🎼🎹☁️ · @jan
337 followers · 2622 posts · Server fedi.kcore.orgHm. I was considering #netdata for local server / vm #monitoring, and looking at it it seems that you can only get all the data in their cloud dashboard?
Seems there are no selfhosted options :(

Mathieu Poussin · @kedare
182 followers · 48 posts · Server g33ks.coffee

Fratm :archlinux: · @fratm
145 followers · 670 posts · Server masto.fratm.com
jcrabapple :virginia_badge: · @jcrabapple
1062 followers · 3219 posts · Server dmv.community
Andy 'Bob' Brockhurst :donor: · @b3cft
130 followers · 241 posts · Server infosec.exchange
Michał "rysiek" Woźniak · 🇺🇦 · @rysiek
11160 followers · 9155 posts · Server mstdn.social

Ste (ėarrivatol'arrotino) · @i0466lt
46 followers · 2 posts · Server mastodon.opencloud.lu[Superquick Linux Tips]
{ovvero: quando con una riga si fa tutto}
Installare client netdata senza spammargli le statistiche di utilizzo:
wget -O /tmp/netdata-kickstart.sh https://my-netdata.io/kickstart.sh && sh /tmp/netdata-kickstart.sh --stable-channel --disable-telemetry
#tips #servermonitoring #netdata #linux