
Fil · @fil
714 followers · 122 posts · Server vis.social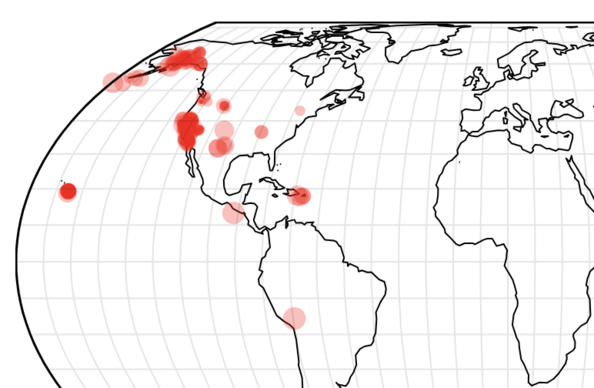
This val uses Observable Plot to generate a map of earthquakes, server-side, from live data. The map is saved and updated on a daily basis, then served as a web page.
Code & details:
https://www.val.town/v/fil.earthquakes
#val.town #observable #cartography

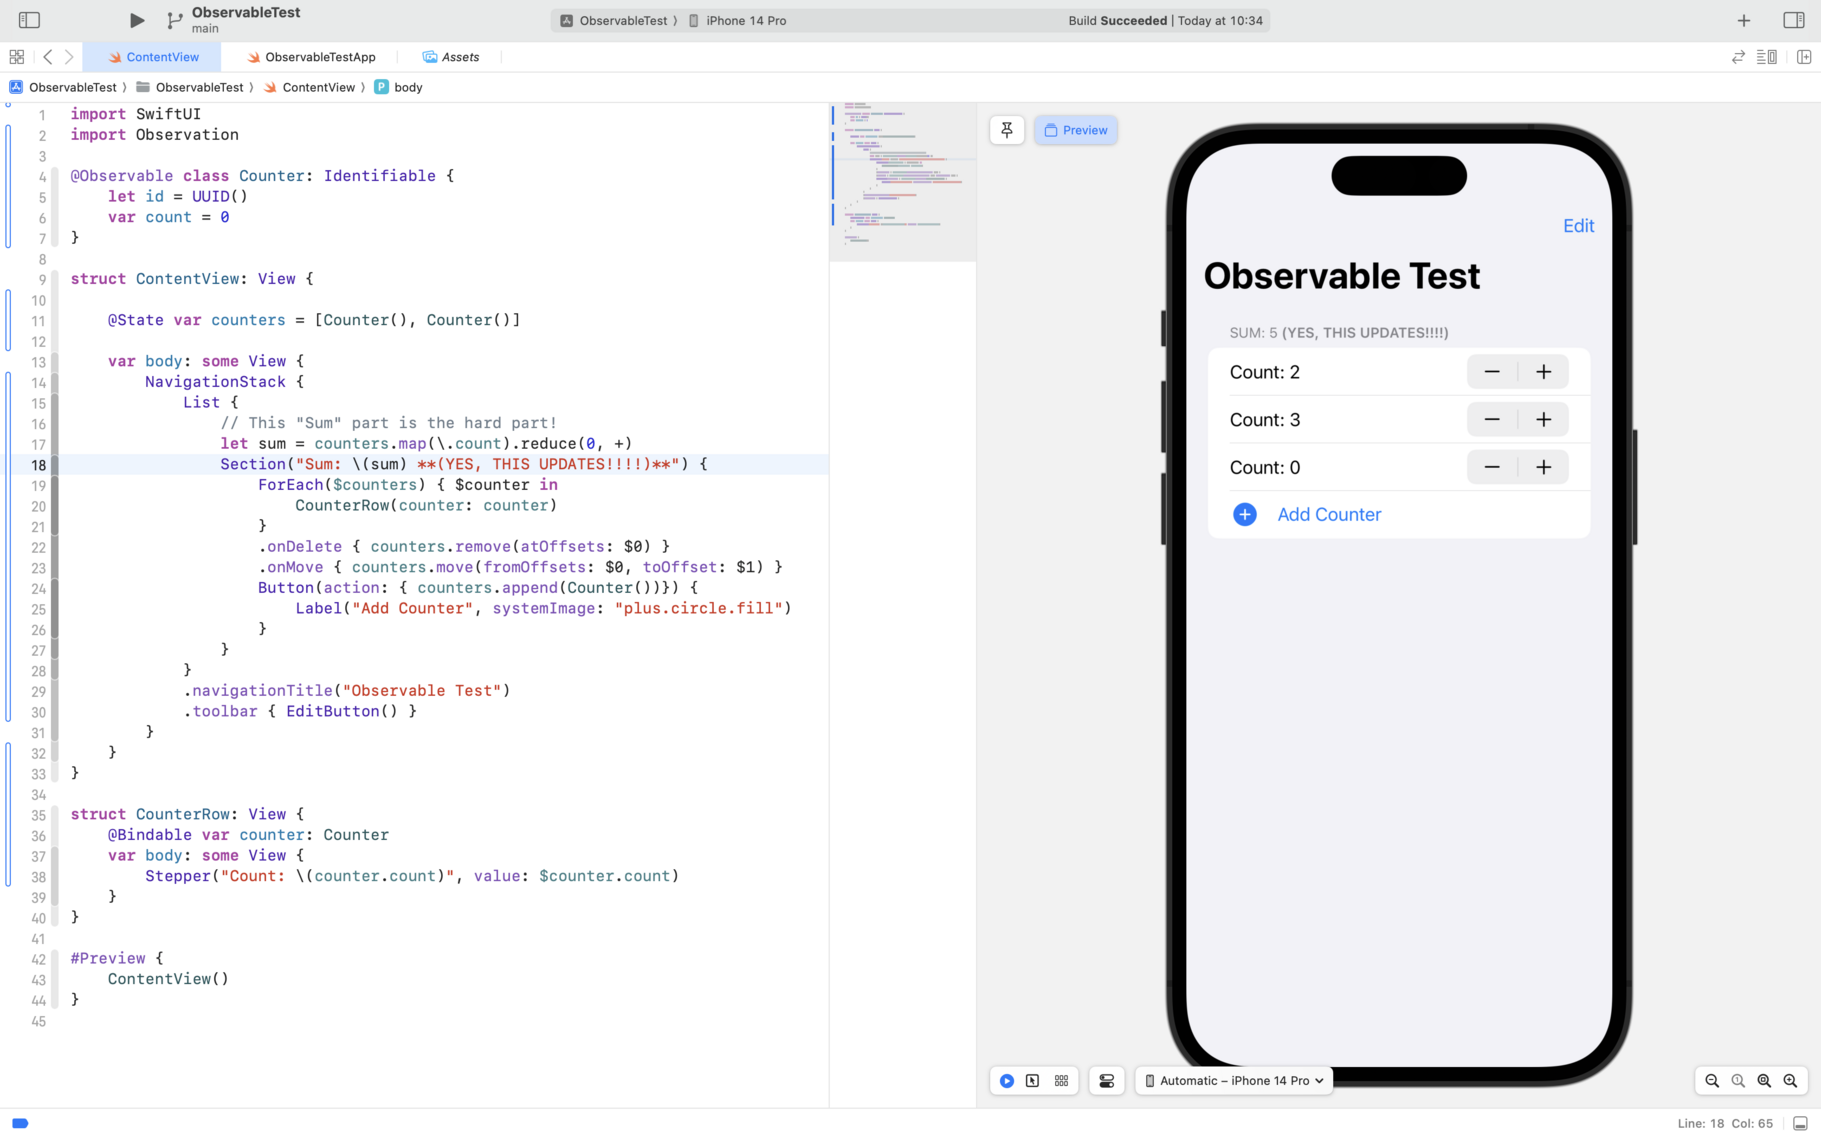
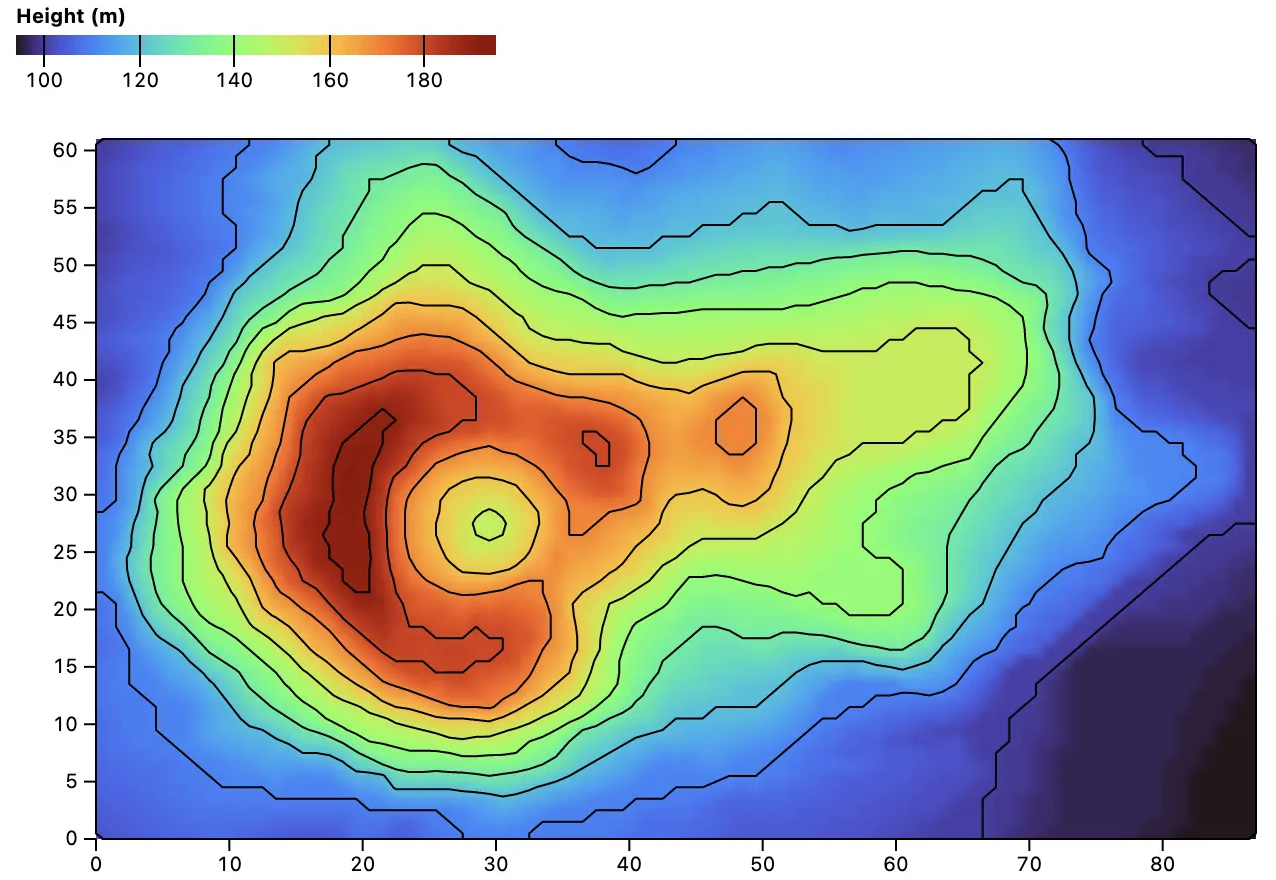
Gernot · @gernot
784 followers · 630 posts · Server mas.to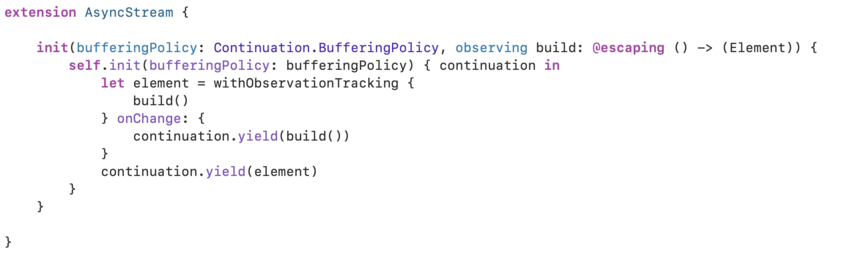
Haven’t tried yet, but could something like this work? #swiftlang #observable
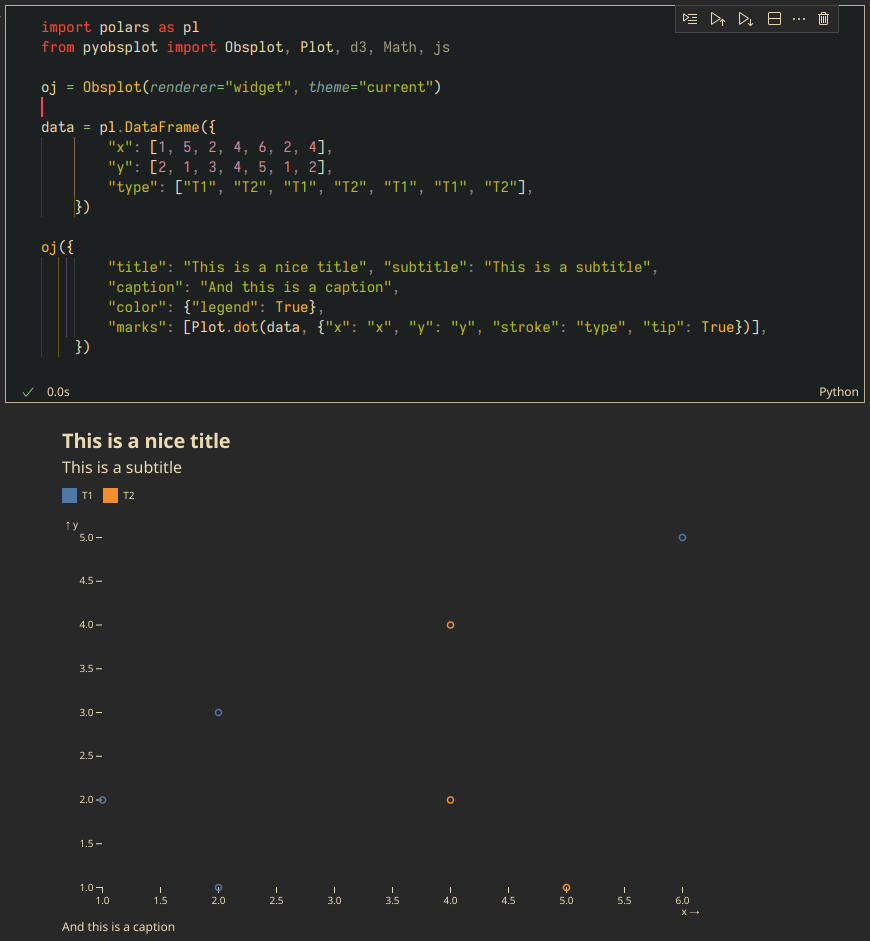
Julien Barnier · @juba
143 followers · 8 posts · Server fosstodon.org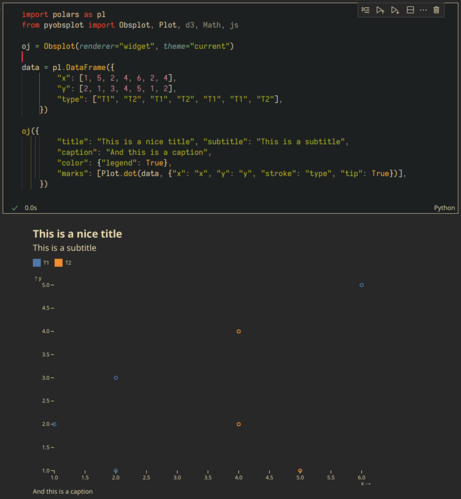
pyobsplot 0.3.8 is out, with Plot updated to 0.6.10. Now with titles and subtitles !
pyobsplot is a #Python package which allows to use #Observable Plot in #jupyter notebooks and #quarto documents with a syntax as close as possible to the JavaScript one.
#python #observable #jupyter #quarto
Gernot · @gernot
741 followers · 439 posts · Server mas.to

Rami Krispin :unverified: · @ramikrispin
889 followers · 406 posts · Server mstdn.social
I love the serverless functionality of the Observable Plot JS library. I updated the US natural gas notebook, adding Streamgraph and connecting it with the data filters 👇
#timeseries #Data #dataviz #observable #JavaScript
Rami Krispin :unverified: · @ramikrispin
889 followers · 406 posts · Server mstdn.social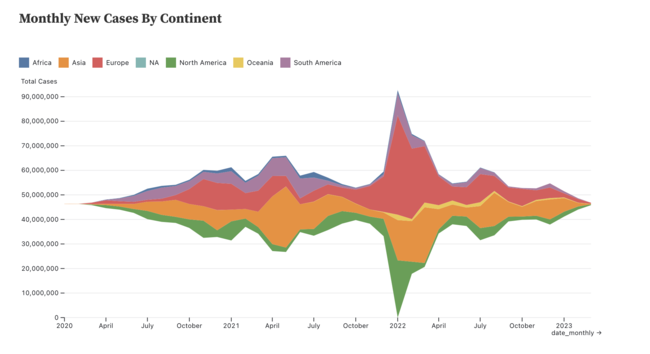
Continue to play with Observable Plot JS library, added a streamgraph plot to the Covid19 notebook 📝 👇
https://observablehq.com/d/38be8564be687a48
Will work in the coming days to convert it to a tutorial 😎
#datavisualization #JavaScript #observable
Rami Krispin :unverified: · @ramikrispin
889 followers · 406 posts · Server mstdn.social
Working on some fun stuff this weekend 😎
Done with the first one on my list -> created a summary plot of the demand for natural gas in the US with the Observable Plot JavaScript library ❤️.
I loaded a tidy format of the data from the USgas R package and used Observable Plot to build filters and plot the data. Super simple 👇🏼
https://observablehq.com/d/73d928e49832a0ad
#observable #rstats #javascript #datavisualization #dataviz #datascience
#DataScience #dataviz #datavisualization #JavaScript #RStats #observable

Deborah Kurata · @deborahkurata
576 followers · 51 posts · Server techhub.socialCheck out my latest video on error handling with Observables:
🧐Catch and Rethrow
🧐Catch and Continue
🧐Retry on Error
🧐RetryWhen
🧐Errors and Action Streams
#angular #RxJS #observable #errorhandling

Noam Ross · @noamross
1660 followers · 706 posts · Server ecoevo.socialAh, the video of @allison_horst's #nyhackr talk on Plot.js talk is up!: https://youtu.be/0srggostAko
#nyhackr #rstats #observable #ObservableJS

Tanya Shapiro · @tanya_shapiro
1147 followers · 87 posts · Server fosstodon.orgObservable is my new data viz playground. Totally new territory, and lots to learn - but it's so exciting to see plots come alive in these notebooks!
Shout out to @allison_horst - thank you for creating amazing resources and inspiring me to try new things 🙂
Code: https://bit.ly/40Tk0ae

Harris Lapiroff 🔥 · @harris
339 followers · 950 posts · Server social.coopNew chart:
1,200 Years of Cherry Blossoms 🌸
#DataViz #ClimateChange #javascript #observable
https://observablehq.com/@harrislapiroff/1200-years-of-cherry-blossoms
#dataviz #climatechange #javascript #observable

🍄🌈🎮💻🚲🥓🎃💀🏴🛻🇺🇸 · @schizanon
258 followers · 3264 posts · Server mas.to#Signals are just the reactivity model from #Solid, #MobX, #Ember, #Knockout, et al. It pushes a notification with an #observable-like mechanism that something has changed, there’s a dependency graph (implicit or explicit) that is notified. Then, it schedules a pull to calculate values. #ReactJS #Preact #javaScript #webDev #frontend
#frontend #webdev #javascript #preact #reactjs #observable #knockout #ember #mobx #solid #signals

Françoise Bahoken · @fbahoken
379 followers · 145 posts · Server mapstodon.space🌟 🌍 🌟 [TTT] Tribute to Tobler
Visualiser la première #loi de la #geographie de W. Tobler ? L’#auto-corrélation #spatiale
by @ljegou
🔗 Sur #Observable : https://observablehq.com/@ljegou/autocorrelation_spatiale
🔗Dans #Neocarto https://neocarto.hypotheses.org/18241
#loi #geographie #auto #spatiale #observable #neocarto
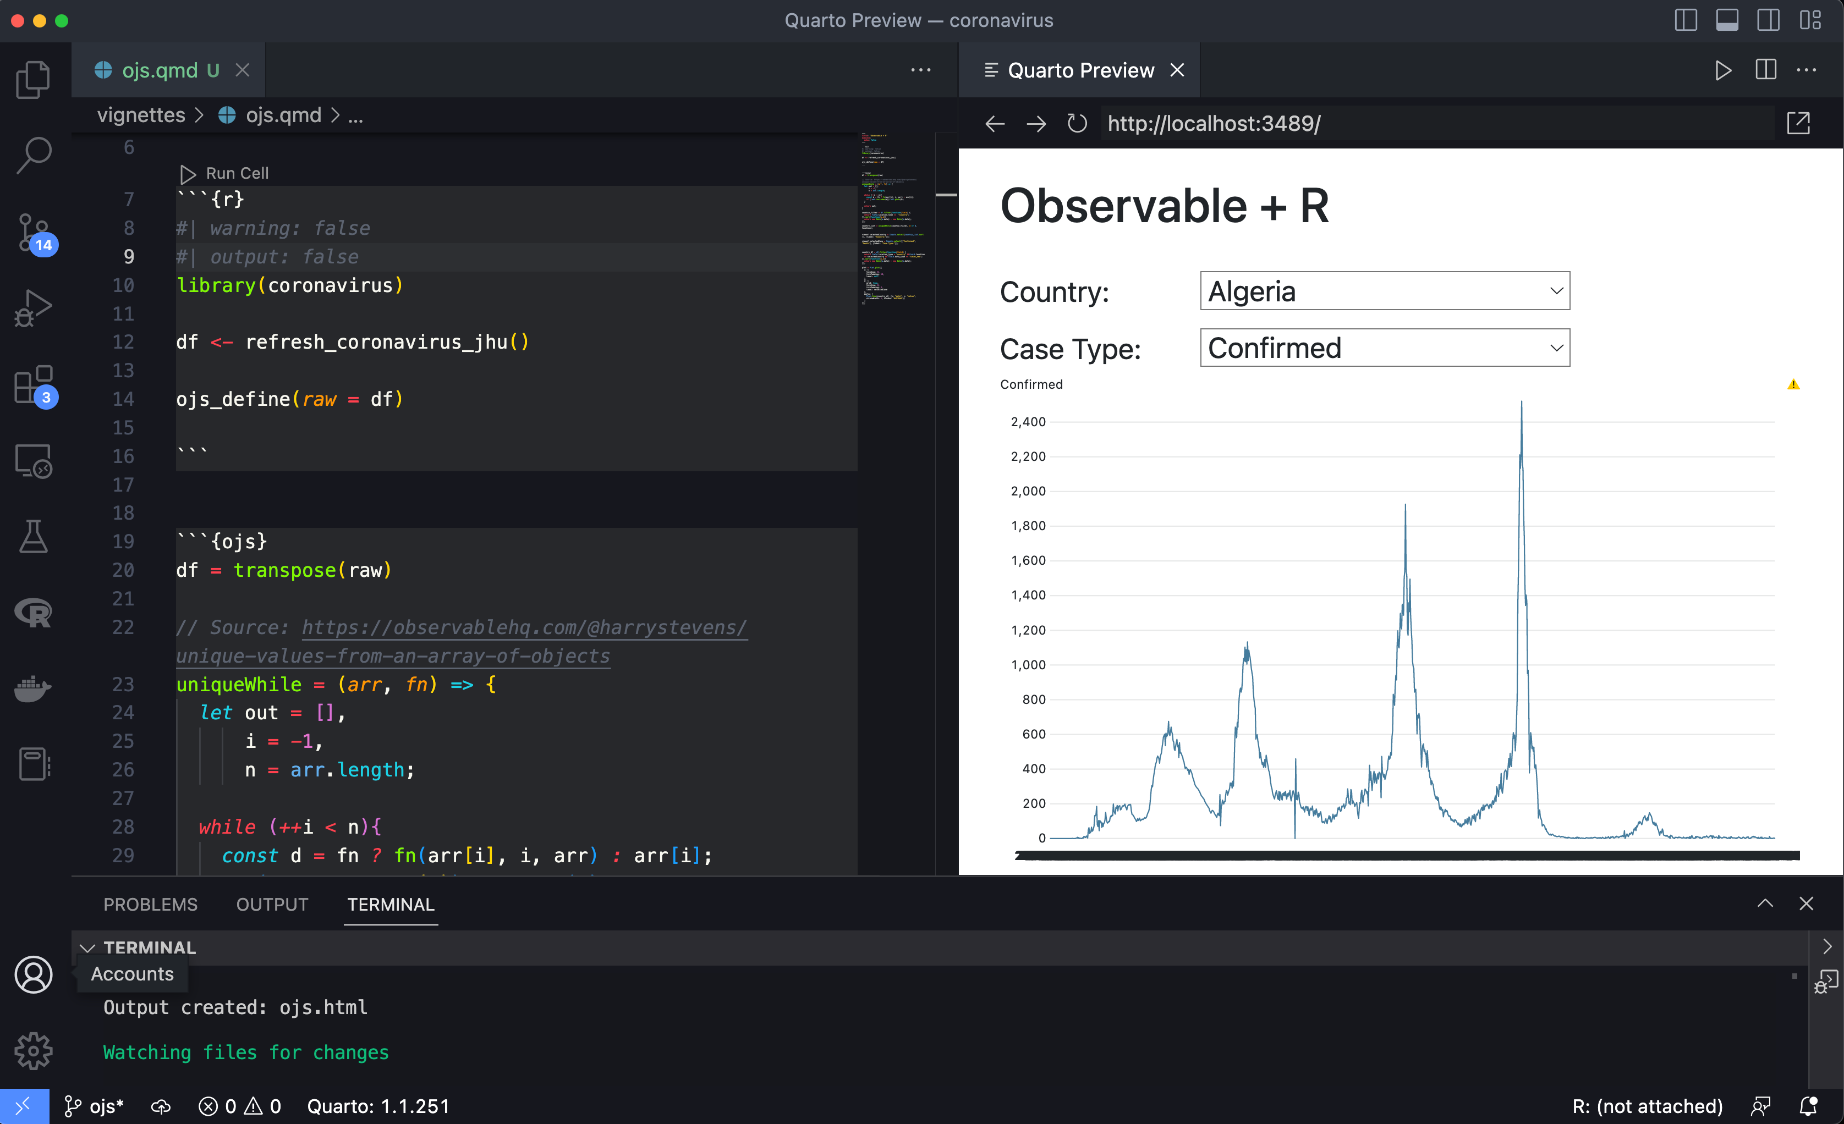
Rami Krispin :unverified: · @ramikrispin
800 followers · 296 posts · Server mstdn.social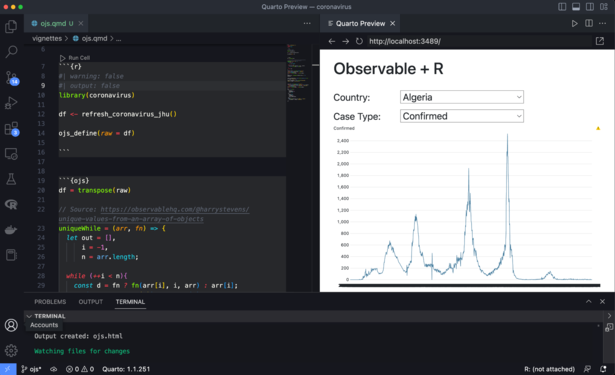
This weekend, playing with Observable + R + Quarto ❤️
#js #quartopub #observable #RStats

Jake Coppinger · @jakecoppinger
173 followers · 110 posts · Server aus.social
“Perceptually uniform color models and their implications”, an #Observable notebook/blog post about colour theory by Max Bo (Software Engineer at Canva).
https://observablehq.com/@mjbo/perceptually-uniform-color-models
#color #colour #theory #srgb #graphicdesign #design #sydney #australia
#observable #color #colour #theory #srgb #graphicdesign #design #sydney #australia

Laurent Jégou · @ljegou
459 followers · 88 posts · Server vis.social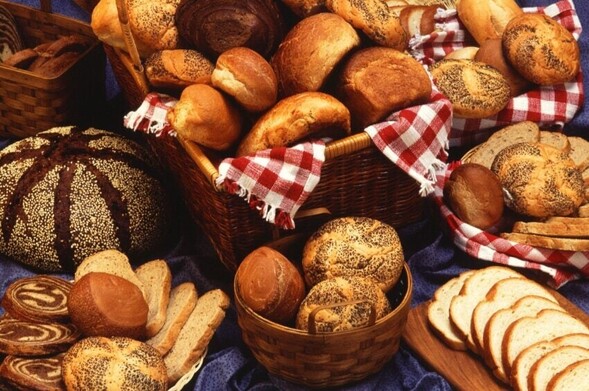
Qu'est-ce que l'Analyse en Composantes Principales ? Un exemple illustré avec #Observable sur un jeu de données rigolo : les types de pain !
Laurent Jégou · @ljegou
459 followers · 88 posts · Server vis.social
Qu'est-ce que l'Analyse en Composantes Principales ? Un exemple illustré avec #Observable sur un jeu de données rigolo : les types de pain !

Adam Gardner · @agardnerit
12 followers · 38 posts · Server techhub.social
Do you use #featureflags ? With #openfeature it is a one-line change to switch from in-house to vendor. OpenFeature is tightly integrated with #opentelemetry so everything is #observable by default. https://docs.openfeature.dev for more info
#featureflags #openfeature #opentelemetry #observable
Rami Krispin :unverified: · @ramikrispin
777 followers · 266 posts · Server mstdn.social
This weekend, I challenged myself and created my first plot with the Observable Plot JS package 😎.
Created a simple widget (and serverless ❤️) to plot COVID-19 cases by country and case type 👇🏼
https://observablehq.com/d/38be8564be687a48
Still a work in progress, but holy 🐮 I can see the potential and use cases for creating serverless applications with Observable Plot.
#DataScience #datavisualization #js #dataviz #observable
Rami Krispin :unverified: · @ramikrispin
743 followers · 239 posts · Server mstdn.social
(1/n)New Release for Observable Plot ❤️❤️❤️
Version 0.6.2 of the 𝐎𝐛𝐬𝐞𝐫𝐯𝐚𝐛𝐥𝐞 𝐏𝐥𝐨𝐭 library was released yesterday. The #Observable Plot is an open-source library for data visualization applications developed by Observable 🚀. It is based on #𝐉𝐚𝐯𝐚𝐒𝐜𝐫𝐢𝐩𝐭, and its main contributor is Mike Bostock, the creator of the 𝐃3 library. The library follows the grammar of graphics inspired by 𝐕𝐞𝐠𝐚-𝐋𝐢𝐭𝐞, 𝐠𝐠𝐩𝐥𝐨𝐭2, 𝐖𝐢𝐥𝐤𝐢𝐧𝐬𝐨𝐧’𝐬 𝐆𝐫𝐚𝐦𝐦𝐚𝐫 𝐨𝐟 𝐆𝐫𝐚𝐩𝐡𝐢𝐜𝐬, and 𝐁𝐞𝐫𝐭𝐢𝐧’𝐬 𝐒𝐞𝐦𝐢𝐨𝐥𝐨𝐠𝐲 𝐨𝐟 𝐆𝐫𝐚𝐩𝐡𝐢𝐜𝐬.
#dataviz #datavisualization #JavaScript #observable