Wolf-Peter Schill · @wpschill
1262 followers · 572 posts · Server social.tchncs.de@aroth 2/ Zunächst reden wir darüber, dass die 🚦 im Erdgasbereich wenige konkrete Ziele & Pläne hatte. Sucht mal nach "Erdgas" im Koalitionsvertrag!
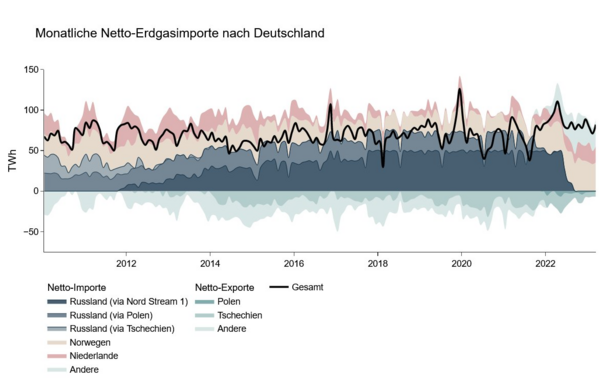
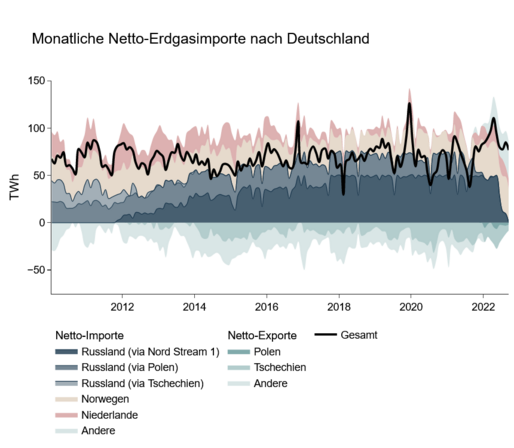
Dann geht's um die Angebotsseite. Hier konnte die über die Jahre stark gewachsene Importabhängigkeit von 🇷🇺 (linke Abbildung) in sehr kurzer Zeit extrem reduziert werden (rechte Abbildung). Aktuelle Zahlen dazu immer im #OpenEnergyTracker: https://openenergytracker.org/de/docs/germany/energyconsumption/#versorgungssicherheit
Wolf-Peter Schill · @wpschill
1261 followers · 570 posts · Server social.tchncs.deMorgen, Samstag 17.06.2023 spreche ich um 20:00 Uhr bei der Langen Nacht der Wissenschaften im Haus der #Leibniz Gemeinschaft über den Stand der Dinge bei der #Energiewende. Grundlage ist der Ampel-Monitor Energiewende des #DIW. Kommt gerne vorbei! #LNDW
Der #Ampelmonitor findet ihr hier: http://diw.de/ampel-monitor
Er basiert auf dem breiteren #OpenEnergyTracker: https://openenergytracker.org/de/
Und die Tonspur dazu gibt's beim Podcast #fossilfrei: www.diw.de/fossilfrei
#FossilFrei #openenergytracker #ampelmonitor #LNDW #diw #energiewende #leibniz
Wolf-Peter Schill · @wpschill
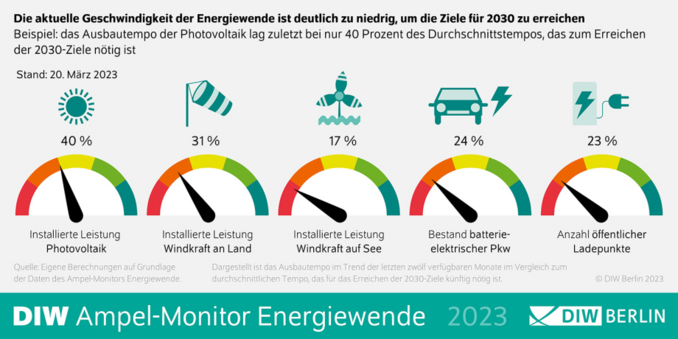
1224 followers · 508 posts · Server social.tchncs.de📢 Jüngstes Update des #DIW Berlin #Ampelmonitor #Energiewende: Aktuelle Ausbaugeschwindigkeit bei #erneuerbaren Energien und #Elektromobilität muss immer noch deutlich gesteigert werden, damit die 2030-Ziele erreicht werden.
Aber der Trend zeigt immerhin in die richtige Richtung.
Zoom- und klickbare Abbildungen auf der Ampelmonitor-Homepage https://www.diw.de/de/diw_01.c.841560.de/ampel-monitor_energiewende.html, und noch mehr Material auf dem dahinter liegenden #openenergytracker https://openenergytracker.org/
#openenergytracker #elektromobilitat #erneuerbaren #energiewende #ampelmonitor #diw
Wolf-Peter Schill · @wpschill
1166 followers · 454 posts · Server social.tchncs.de#GermanEnergyFact #19: heat pumps
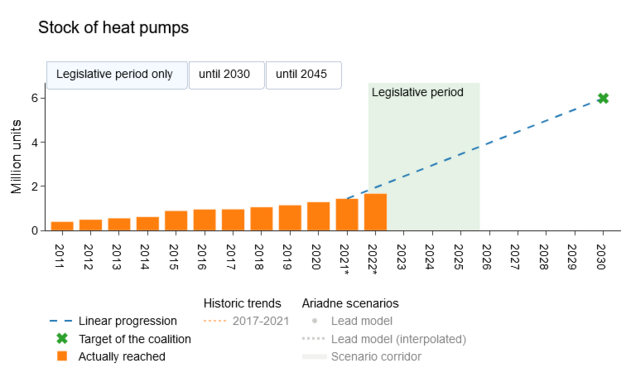
▶️ In 2022, 236,000 new #heatpumps were installed in 🇩🇪 - a new record! Source: https://www.waermepumpe.de/presse/pressemitteilungen/details/waermepumpenabsatz-2022-wachstum-von-53-prozent-gegenueber-dem-vorjahr/#content
▶️ The stock of heat pumps increased to nearly 1.7 million (note: this also includes some heat pumps that only provide domestic hot water).
▶️ The 🇩🇪 government aims for a yearly addition of 500,000 heat pumps from 2024 on, and a stock of at least 6 mio by 2030.
Additional info, zoomable graph and underlying data on the #openenergytracker: https://openenergytracker.org/en/docs/germany/heat/#heat-pumps
#openenergytracker #heatpumps #germanenergyfact
Wolf-Peter Schill · @wpschill
1164 followers · 448 posts · Server social.tchncs.de#GermanEnergyFact #18: installed capacity of #offshore #wind power in 🇩🇪
Now, offshore wind, again using data by #AGEE-Stat / #Umweltbundesamt: https://www.umweltbundesamt.de/themen/klima-energie/erneuerbare-energien/erneuerbare-energien-in-zahlen/monats-quartalsdaten-der-agee-stat. Graphs from the #openenergytracker: https://openenergytracker.org/en/docs/germany/electricity/#offshore
▶️ By the end of Nov 22, the installed offshore wind power capacity was 8.1 GW.
▶️ There has been hardly any development for years.
▶️ But now 🇩🇪 really plans to get started with a 30 GW target for 2030.
▶️ In 2023 alone, there will be tenders for an additional 8.8 (!) GW.
#openenergytracker #umweltbundesamt #AGEE #wind #offshore #germanenergyfact
Wolf-Peter Schill · @wpschill
1163 followers · 444 posts · Server social.tchncs.de#GermanEnergyFact #17: installed capacity of #onshore #wind power in 🇩🇪
Let's continue with onshore wind capacity, again using data by #AGEE-Stat / #Umweltbundesamt: https://www.umweltbundesamt.de/themen/klima-energie/erneuerbare-energien/erneuerbare-energien-in-zahlen/monats-quartalsdaten-der-agee-stat. Graphs from the #openenergytracker: https://openenergytracker.org/en/docs/germany/electricity/#wind-energy
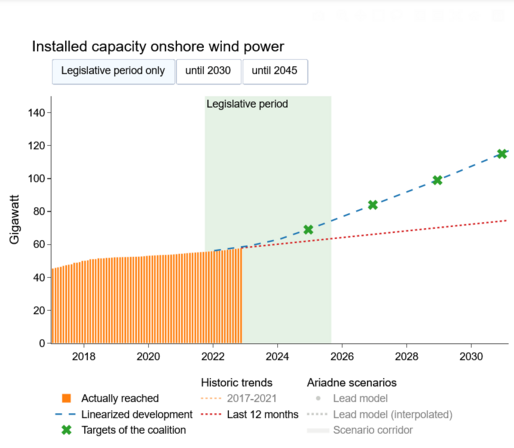
▶️ By the end of Nov 22, the installed onshore wind capacity was 57.9 GW.
▶️ The 🇩🇪 government aims for 115 GW by 2030.
▶️ Currently we are below the required expansion path, and the speed has to increase a lot to meet the 2030 target.
#energiewende #openenergytracker #umweltbundesamt #AGEE #wind #onshore #germanenergyfact
Wolf-Peter Schill · @wpschill
1160 followers · 437 posts · Server social.tchncs.de#GermanEnergyFact #16: installed capacity of #solar #PV in 🇩🇪
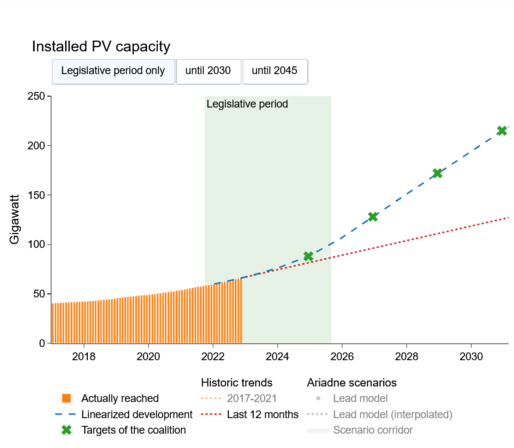
I promised this week would focus on #renewables, so let's continue with solar #photovoltaics capacity, using data published today by #AGEE-Stat / #Umweltbundesamt: https://www.umweltbundesamt.de/themen/klima-energie/erneuerbare-energien/erneuerbare-energien-in-zahlen/monats-quartalsdaten-der-agee-stat. Graphs from the #openenergytracker: https://openenergytracker.org/en/docs/germany/electricity/#solar-pv
▶️ By the end of Nov 22, PV capacity was 66.1 GW.
▶️ The 🇩🇪 government aims for 215 GW by 2030.
▶️ Currently we are on track, but the expansion speed has to increase to meet the 2030 target.
#openenergytracker #umweltbundesamt #AGEE #photovoltaics #renewables #pv #solar #germanenergyfact
Wolf-Peter Schill · @wpschill
1156 followers · 434 posts · Server social.tchncs.de#GermanEnergyFact #15: share of #renewables in the #electricity sector
New data for 2022 provided by @BMWK: https://www.bmwk.de/Redaktion/DE/Downloads/Energie/230102-erneuerbare-energien-ueberblick-zubauzahlen-und-beschleunigungsmassnahmen.pdf?__blob=publicationFile&v=4. Click- and zoomable graph in the #openenergytracker: https://openenergytracker.org/en/docs/germany/electricity/#shares-in-the-power-sector
▶️ The 🇩🇪 government aims for a share of 80% renewable generation in gross electricity consumption by 2030.
▶️ In 2022, this share increased to ~47% according to #BMWK, driven by a better #wind and #solar year, and some expansion of #renewable capacities (particularly solar).
#energiewende #renewable #solar #wind #BMWK #openenergytracker #electricity #renewables #germanenergyfact
Wolf-Peter Schill · @wpschill
1150 followers · 427 posts · Server social.tchncs.de#GermanEnergyFact #12 ctd.
▶️ The #EEG levy, which has been charged since 2000 to finance the expansion of renewable energy sources, was abolished on July 1, 2022.
▶️ However, this relief was more than offset by the increase in procurement costs in 2022.
▶️ You can expect that prices continue to increase in 2023, probably to (or above) 50 ct/kWh.
Click- and zoomable graphs and underlying data (also an inflation-adjusted version) in 🇬🇧 , 🇩🇪 and 🇫🇷 in the #openenergytracker: https://openenergytracker.org/en/docs/germany/prices/
#openenergytracker #eeg #germanenergyfact
Wolf-Peter Schill · @wpschill
1148 followers · 420 posts · Server social.tchncs.de#GermanEnergyFact #7 ctd.
Zooming in on #gas savings made by households and commercial consumers: in the #openenergytracker, we regularly differentiate savings components related to temperature and to changes in behavior: https://openenergytracker.org/en/docs/germany/naturalgas/
We find that households and commerce have consistently saved gas by changing their behavior since September 2022. Except for the Christmas week it seems - maybe people wanted to have it as cosy as usual during these days? 🎄 Great work by @aroth 👏
#openenergytracker #gas #germanenergyfact
Wolf-Peter Schill · @wpschill
1104 followers · 384 posts · Server social.tchncs.de#GermanEnergyFact #4: Electric vehicles 🔌 🚗
Again, I wanted to continue with energy consumption facts... but because of current events, I HAVE to talk about electric cars! Today new must-see #KBA data came out. All data and zoomable graphs also available in the #openenergytracker: https://openenergytracker.org/en/docs/germany/emobility/
▶️ December 2022: Highest-ever share of battery-electric vehicles (#BEV) in new #car registrations in 🇩🇪 , 33.2%!
▶️ Also, a record share for plug-in hybrids (#PHEV) in December with 22.2%.
#phev #car #bev #openenergytracker #kba #germanenergyfact
Wolf-Peter Schill · @wpschill
1095 followers · 377 posts · Server social.tchncs.de#GermanEnergyFact #3 ctd.
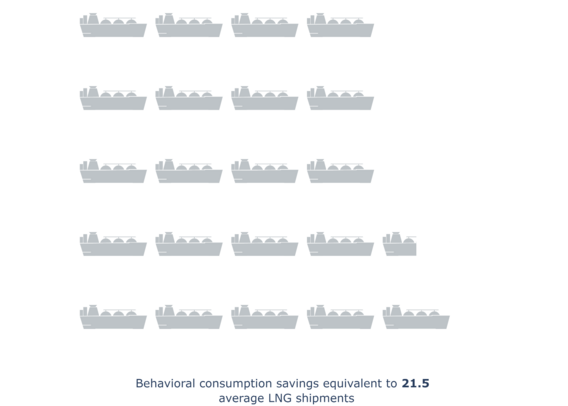
Since September 2022, the residential and commercial sectors in 🇩🇪 already saved natural #gas equivalent to 21.5 (!) average #LNG tankers purely because of changes in behavior. This is what my colleagues @aroth and Felix Schmidt found in an analysis that we constantly update on the #DIW #Ampelmonitor #Energiewende: https://www.diw.de/en/diw_01.c.841560.en/ampel-monitor_energiewende__monitor_of_the_german__traffic_light__coalition___s_energy_transition_targets.html#ab_862329
More graphs and info on the methods used are available in the #openenergytracker: https://openenergytracker.org/en/docs/germany/naturalgas/
#openenergytracker #energiewende #ampelmonitor #diw #lng #gas #germanenergyfact
Wolf-Peter Schill · @wpschill
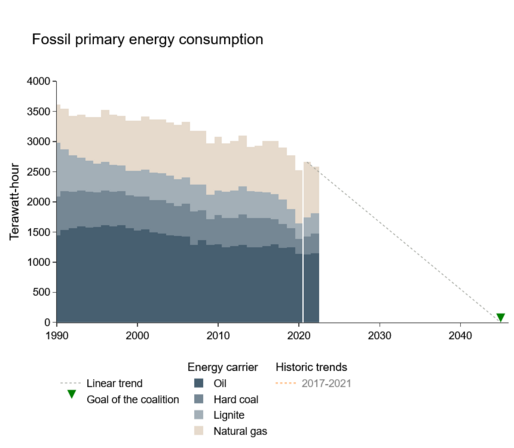
1024 followers · 365 posts · Server social.tchncs.de#GermanEnergyFact #2: Let's have a closer look at the development of the fossil part of primary energy consumption in 🇩🇪. We regularly track this in the #openenergytracker, where I also take the following graphs from. Zoom- & clickable graphs and underlying data here: https://openenergytracker.org/en/docs/germany/energyconsumption/#fossil-energy-primary-consumption
▶️ Between 1990-2022, fossil #primaryenergyconsumption decreased by 28%.
▶️ 2020 saw the lowest consumption so far, driven by the pandemic.
▶️ In 2021, consumption increased again because of economic recovery.
#primaryenergyconsumption #openenergytracker #germanenergyfact
Wolf-Peter Schill · @wpschill
970 followers · 349 posts · Server social.tchncs.deMore than 20 LNG tankers.
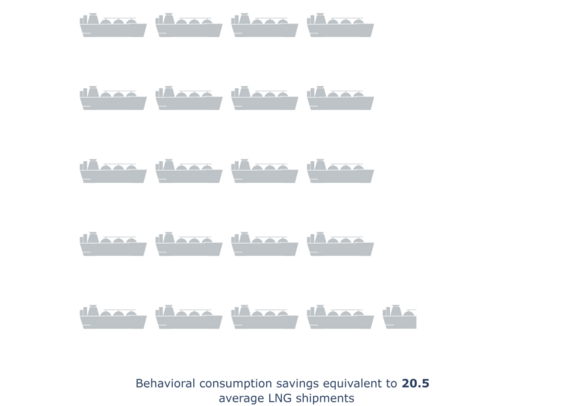
This is the amount of natural #gas that German households and commerce already saved by changing their behavior in this heating period. More analysis and data in the #DIW #Ampelmonitor and #openenergytracker. https://www.diw.de/sixcms/media.php/37/thumbnails/fig_gas_lng_en.png.613237.png https://www.diw.de/en/diw_01.c.841560.en/ampel-monitor_energiewende__monitor_of_the_german__traffic_light__coalition___s_energy_transition_targets.html#ab_862329
#openenergytracker #ampelmonitor #diw #gas
Wolf-Peter Schill · @wpschill
971 followers · 350 posts · Server social.tchncs.deMore than 20 LNG tankers.
This is the amount of natural #gas that German households and commerce already saved by changing their behavior in this heating period. More analysis and data in the #DIW #Ampelmonitor and #openenergytracker. https://www.diw.de/sixcms/media.php/37/thumbnails/fig_gas_lng_en.png.613237.png https://www.diw.de/en/diw_01.c.841560.en/ampel-monitor_energiewende__monitor_of_the_german__traffic_light__coalition___s_energy_transition_targets.html#ab_862329
#openenergytracker #ampelmonitor #diw #gas
Wolf-Peter Schill · @wpschill
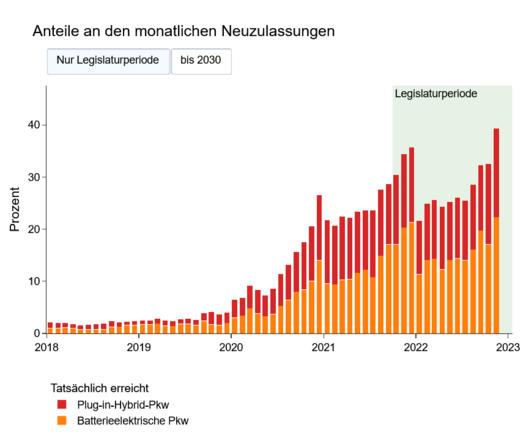
885 followers · 311 posts · Server social.tchncs.de@aroth Zu den Zulassungen von batterieelektrischen #Pkw hier noch mal eine Extra-Grafik aus dem #openenergytracker:
Hier gab es im November Zulassungsrekorde sowohl bei den reinen #BEV (22,3 % der Neuzulassungen), als auch bei den (energie- und klimapolitisch durchaus umstrittenen) Plug-in-Hybriden #PHEV (17,1 %). Somit hatten fast 40 % aller neuen Pkw in Deutschland im November einen Stecker!
#Elektromobilität https://openenergytracker.org/docs/germany/emobility/
#elektromobilitat #phev #bev #openenergytracker #pkw
Wolf-Peter Schill · @wpschill
885 followers · 311 posts · Server social.tchncs.de@aroth Und schon wieder ein kleines Update zum #DIW #Ampelmonitor. Neu:
▶️ Das Tempo bei #PV und #Offshore #Windkraft hat weiter leicht angezogen (auf noch immer viel zu niedrigem Niveau)
▶️ Neue Zulassungsrekorde im November bei batterieelektrischen Pkw
▶️ Jetzt 0,93 Mio #BEV-Pkw in 🇩🇪 - die 1 Mio ist nah! (leider immer noch unter dem Zielpfad)
Die wichtigsten Infos auf der Hauptseite https://www.diw.de/de/diw_01.c.841560.de/ampel-monitor_energiewende.html, alle Indikatoren im #openenergytrackerhttps://openenergytracker.org/docs/germany/home/
#openenergytracker #bev #windkraft #offshore #pv #ampelmonitor #diw
Wolf-Peter Schill · @wpschill
714 followers · 251 posts · Server social.tchncs.deMy talk on how the 🇩🇪 #Energiewende is going, which I recently gave at the University of #Melbourne, is now available online 🎉
In less than an hour, I give a brief introduction to the #openenergytracker and walk you through some of the most important indicators, covering #solar #PV, #wind power, #electricmobility, green #hydrogen, natural #gas and electricity prices.
I also tried to compare the situation & targets in 🇩🇪 to 🇦🇺 wherever I could. Feedback welcome!
#gas #hydrogen #electricmobility #wind #pv #solar #openenergytracker #melbourne #energiewende
Wolf-Peter Schill · @wpschill
536 followers · 155 posts · Server social.tchncs.deFür alle, die lieber auf 🇩🇪 lesen: diese Infos zu Importen und Verbrauch von #Erdgas samt klick- und zoombaren Abbildungen gibt es im #openenergytracker auch auf Deutsch ⬇️ https://openenergytracker.org/docs/germany/energyconsumption/#versorgungssicherheit
Wolf-Peter Schill · @wpschill
536 followers · 155 posts · Server social.tchncs.de🚨 Another #openenergytracker update: German #naturalgas imports.
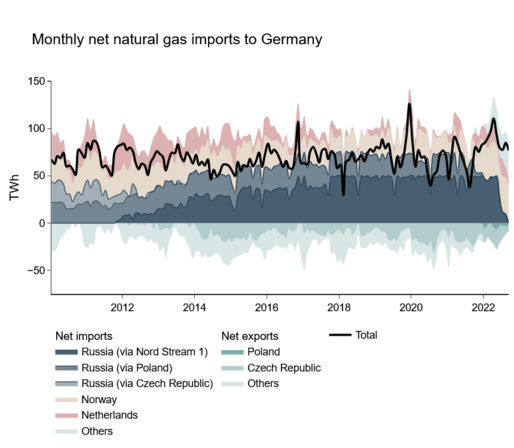
Dependence on 🇷🇺 natural gas imports has grown after 2012. Direct (via Nord Stream 1) and indirect (via Poland) gas imports from #Russia were roughly on par with total net imports in 2018-2021. Since late 2021, Russian net imports have declined significantly, and in September 2022 they fell to zero for the first time. At the same time, net imports have tended to increase (!) overall.
Zoomable graph & data: https://openenergytracker.org/en/docs/germany/energyconsumption/
#russia #naturalgas #openenergytracker
