
GregCocks · @GregCocks
425 followers · 455 posts · Server techhub.social
Past And Future Warming – Direct Comparison On Multi-Century Timescales
--
https://doi.org/10.5194/cp-18-911-2022 <-- shared paper / technical note
--
#GIS #spatial #mapping #anthropogenic #climatechange #humanimpact #global #temperature #millenia #centuries #model #modeling #spatialanalysis #IPCC #globalmeantemperatures #paleotemperature #reconstruction #warming #impacts #multicentury #greenhousegasemissions #emissions #holocene #spatiotemporal #variability
#gis #spatial #mapping #anthropogenic #climatechange #humanimpact #global #temperature #millenia #centuries #model #modeling #spatialanalysis #ipcc #globalmeantemperatures #paleotemperature #reconstruction #warming #impacts #multicentury #greenhousegasemissions #emissions #Holocene #spatiotemporal #variability

Nina Davtian · @nina_davtian
381 followers · 565 posts · Server mastodon.world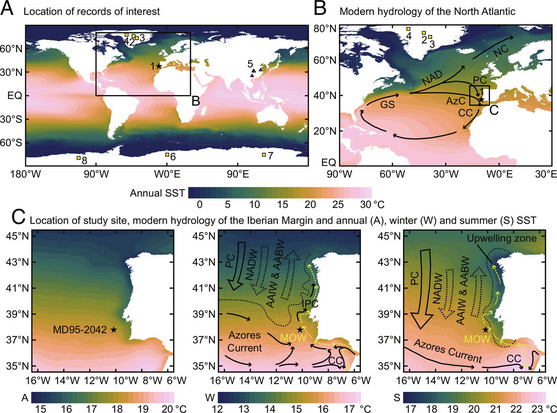
New first-authored #scientific #publication in @PNASNews with Edouard Bard (Collège de France and CEREGE)!
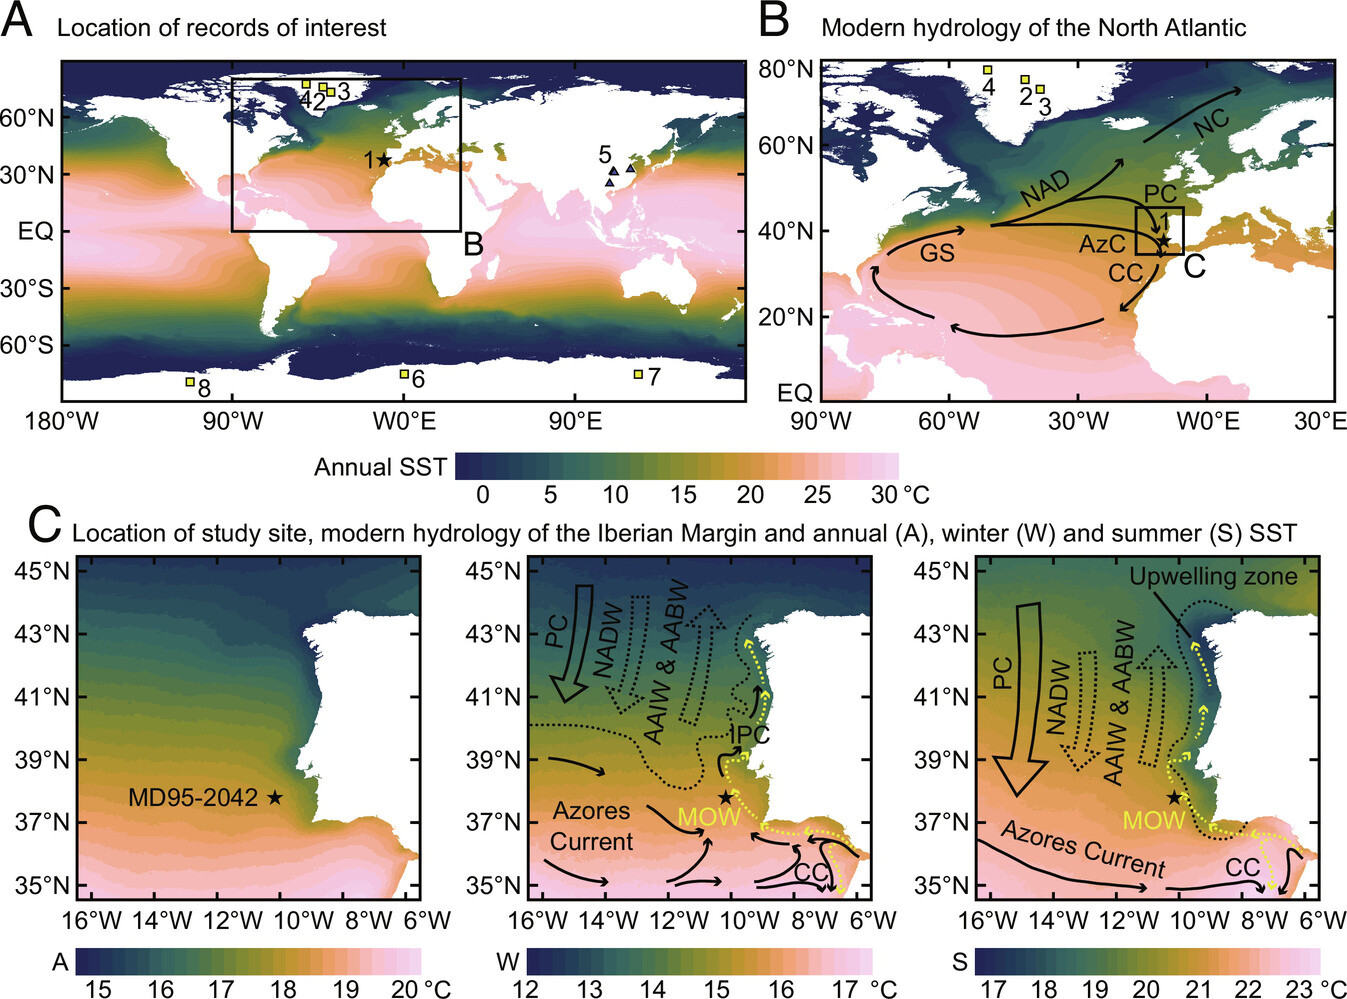
We revisit the #thermal bipolar seesaw using #PaleoTemperature records from the #IberianMargin!
#Science #Paper #FirstAuthor
#PaleoClimate #PaleoClimates
#ClimateChanges #AbruptClimateChange
#SeaSurfaceTemperature #SST
#ClimateProxies #GDGTs #RIOH #Alkenones #UK37
#NorthAtlantic #AtlanticOcean #Atlantic #Ocean
#AtlanticMeridionalOverturningCirculation #AMOC
https://doi.org/10.1073/pnas.2209558120 (1/20)
#scientific #publication #Thermal #paleotemperature #iberianmargin #science #paper #firstauthor #paleoclimate #Paleoclimates #climatechanges #abruptclimatechange #seasurfacetemperature #sst #climateproxies #gdgts #rioh #alkenones #uk37 #northatlantic #atlanticocean #atlantic #ocean #atlanticmeridionaloverturningcirculation #amoc

· @anlomedad
222 followers · 790 posts · Server climatejustice.social
There was a zombie climate denier chart going around in German social media these days. A temperature anomaly chart from Greenland's Summit ice core, range 7000 years ago to 1850 or thereabouts.
From the comments by NON-deniers I gathered that many of us have not much understanding of how global mean temperature (anomaly) is calculated and modelled as reconstruction from
*latitudinal* or regional or local
proxies like ice cores, ocean or lake sediments, treerings, stalagmites or whathaveyou.
Ideally, a point in Greenland weighs as much in calculating global mean annual temperature as a point in Iran or one in the Southern Ocean. Same goes for temperature reconstruction models.
Except those are even trickier, as you can imagine. Because finding so many proxies ...
And then bear in mind how vast the space is that is covered by oceans which don't have much, and if, very slow temperature variations. That's why we often read the phrase "Europe (or some other region) warms twice as fast as the rest of the world". In our suicidal experiment, land simply warms faster than oceans. That's all. (Almost.)
Long story short. Maybe, your mind works like mine and needs to see latitudinal temperature bands of the whole globe, and the paleo reconstruction of temperature variations of the latitude bands.
So here goes. A globe with 2021 absolute annual temperature. To the left are the northern hemisphere bands in 30º steps from the pole to equator, and their ºC variation from 7000 to present. ("Present" is defined as 1950)
To the right, the Southern steps from equator to pole.
The next two images show annual temperature of 1950 and the same holocene temperature as the first picture, Northern and Southern latitude bands.
Data is from Kaufmann et al 2020. You can access the dataset here https://www.ncei.noaa.gov/access/paleo-search/study/29712
or as csv https://www.ncei.noaa.gov/pub/data/paleo/reconstructions/kaufman2020/temp12k_allmethods_percentiles.csv
The globe picture is from here https://climatereanalyzer.org/reanalysis/monthly_maps/
Hashtags:
#Paleoclimate #ClimateDenier #PaleoTemperature #Holocene
#paleoclimate #Climatedenier #paleotemperature #holocene