
Ploomber · @ploomber
26 followers · 21 posts · Server fosstodon.org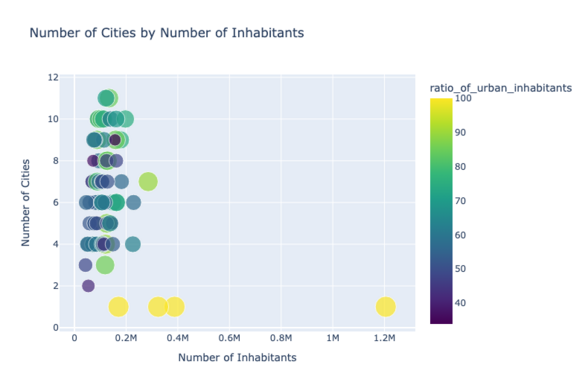
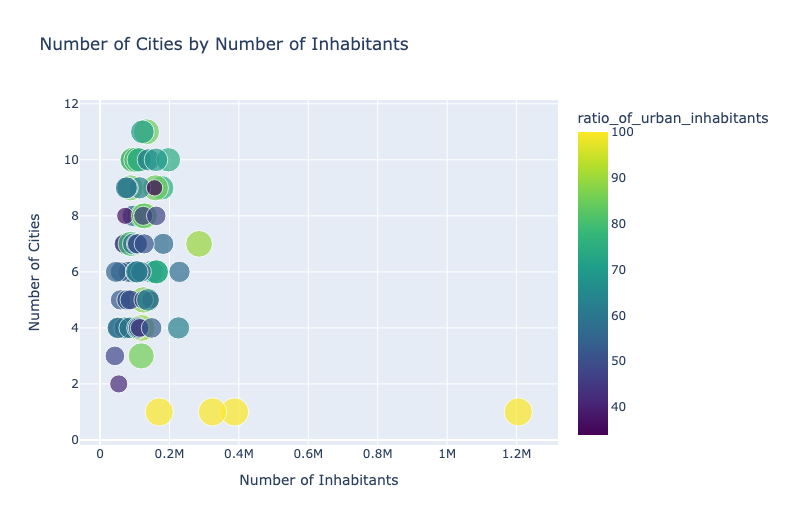
Unveiling a detailed walkthrough on visualizing #SQL queries with Plotly, a versatile #visualization library, using the #Ploomber package in our latest blog post.
Gain insights into the process from ground zero- starting with package installation, #data loading, creating, and loading tables onto a Python-SQL Jupyter Notebook, to the grand finale - visualizing data via various plots.
🔗 Google Colab: https://colab.research.google.com/github/ploomber/sql/blob/main/colabs/visualizing-your-sql-queries/plotting-with-plotly.ipynb
🔗 JupyterBook: https://ploomber-sql.readthedocs.io/en/latest/visualizing-your-sql-queries/plotting-with-plotly.html
#sql #visualization #ploomber #data #datavisualization #plotly

Juan Luis · @astrojuanlu
1244 followers · 1628 posts · Server social.juanlu.space
Noticias sobre Python y Datos de la semana, episodio 73 🐍⚙️
En resumen: Versiones nuevas de JupySQL, Modin, Prefect y más, machine learning "doble", detección de comunidades en grafos, ojo a la chi2 de scikit-learn, y noticias del viejo Spyder
https://astrojuanlu.substack.com/p/episodio-73
Apoya el noticiero suscribiéndote por correo 📬
#python #pydata #jupysql #ploomber #modin #prefect #doubleml #networkx #sklearn #spyder
#python #PyData #jupysql #ploomber #modin #prefect #DoubleML #networkx #Sklearn #spyder