Elias Dabbas :verified: · @elias
63 followers · 108 posts · Server seocommunity.socialHappy to announce a new cohort for my course:
Data Science with Python for SEO 🎉 🎉 🎉
🔵 For absolute beginners
🔵 Run, automate, and scale many SEO tasks with Python like crawling, analyzing XML sitemaps, text/keyword analysis
🔵 Intro to data manipulation and visualization skills
🔵 Get started with #advertools #pandas and #plotly
🔵 Make the transition from #Excel to #Python
🔵 Online, live, cohort-based, interactive
🔵 Spans three days in one week
#advertools #pandas #plotly #excel #python

Hok Deejay :vf: :apple: · @Hok
33 followers · 240 posts · Server masto.es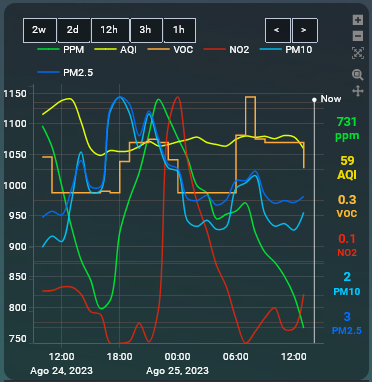
Creo que se me ha ido la olla con esta gráfica, no se entiende nada!, ni de cerca ni de lejos. A ver como lo arreglo... #plotly

EvgenyNr · @evgenynr
7 followers · 124 posts · Server toot.ioПочему мне нравится #plotly, и не так нравится #matplotlib?
1. Plotly имеет функциональный интерфейс и не приходится иметь дело с ненавистным глабальным состоянием, провоцирующим крышесносные ошибки в matplotlib (например в matplotlib можно случайно вызвать `clf()` до создания `figure()` с непредсказуемым поведением 🤪)
@ru
#plotly #matplotlib #plotlypotbot #dataviz #science #functionalprogramming

Jan Kühn · @yotka
23 followers · 23 posts · Server vis.social
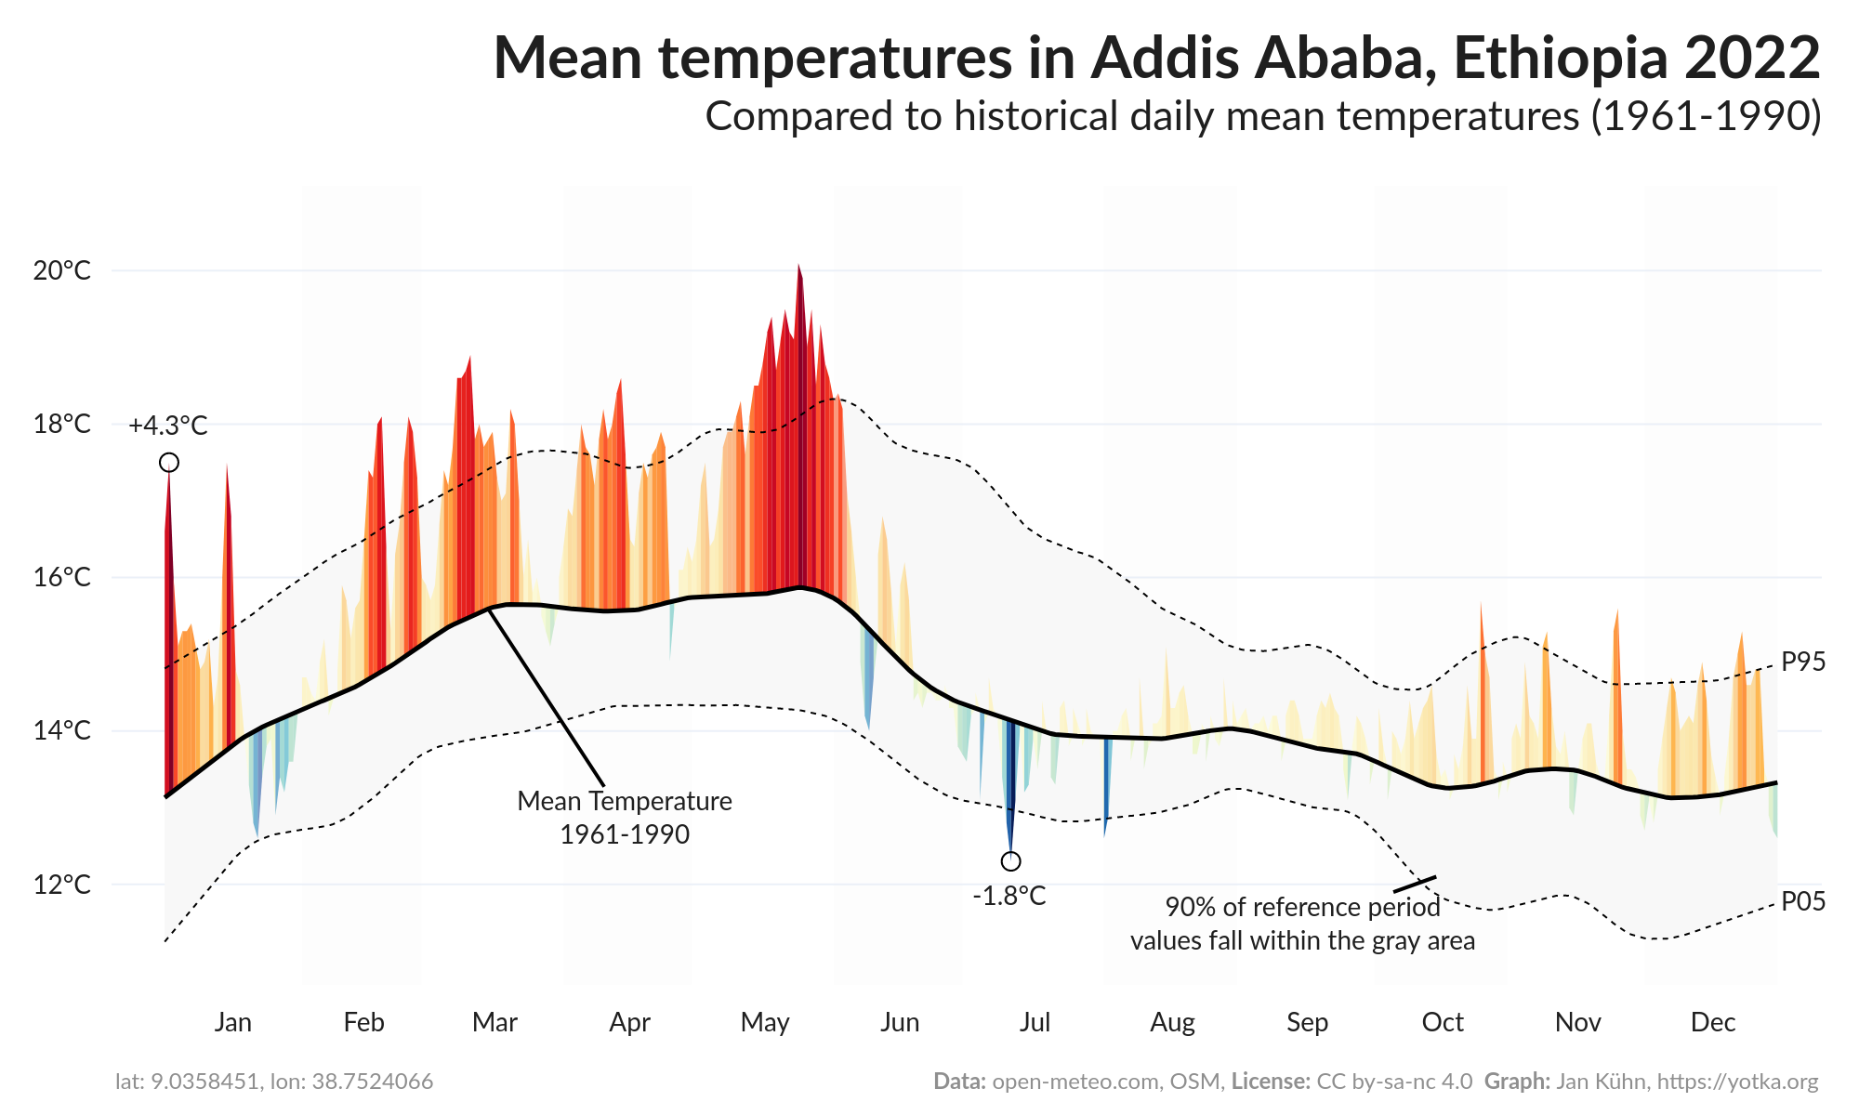
Still, you can download the plot as a static PNG image. For smaller screens, a static version is displayed automatically.
The latest version has seen some major refactoring and now uses #Plotly instead of #Matplotlib. The data comes, as before, from @openmeteo .
EvgenyNr · @evgenynr
5 followers · 102 posts · Server toot.ioGo learn Scala with me!
I'm interesting in functional programming and have experience in Haskell, now writing a Telegram bot with Scala. The bot to share plots and charts drawn with Plotly lib. Telegram stores a chart, the bot gives link to web page with it embedded. I'm planning to post here about this stuff in English and Russian. Hope this helps someone to become a better developer!
@ru
#plotlypotbot #scala #plotly #DataViz #science #fp #functionalprogramming #programming
#plotlypotbot #scala #plotly #dataviz #science #fp #functionalprogramming #programming

Sharon Machlis · @smach
2296 followers · 235 posts · Server masto.machlis.com
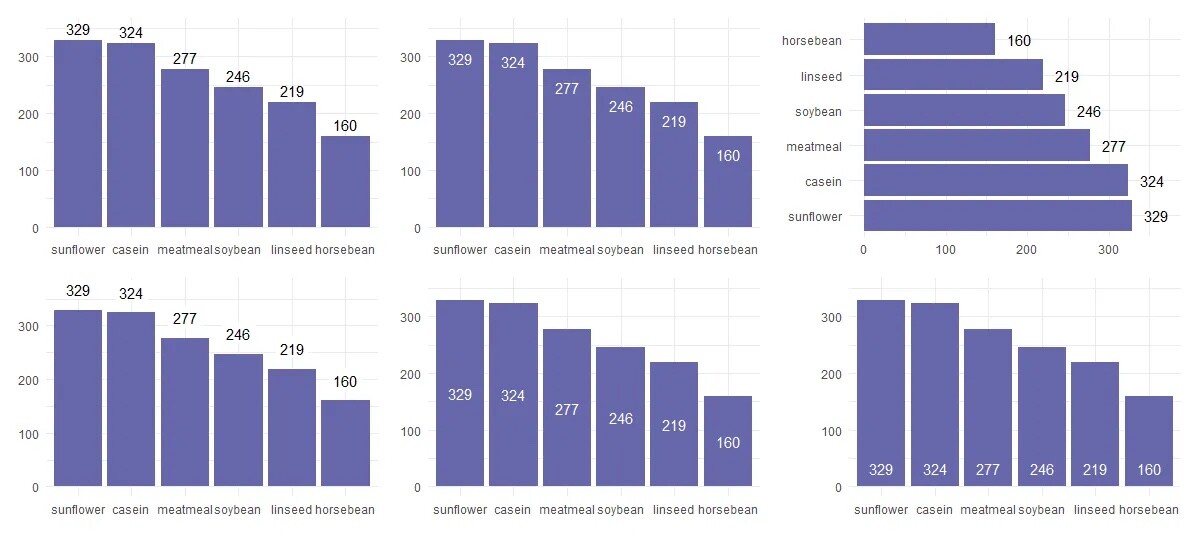
How to add labels to your ggplot2 and plotly graphs in R: examples and code by Jānis Stūris
https://datacornering.com/add-data-labels-to-column-or-bar-chart-in-r/
#rstats #ggplot #ggplot2 #plotly #DataViz #DataVis #R @rstats
#rstats #ggplot #ggplot2 #plotly #dataviz #datavis #r

Gabrielle Schroeder · @gmschroe
50 followers · 18 posts · Server fosstodon.org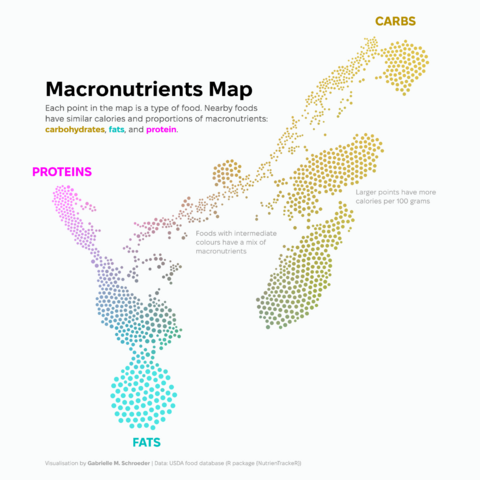
I’ve started experimenting with interactive #DataViz using #Plotly. Here’s a “map” of different foods that I made using plotly in #RStats. The foods are embedded in two dimensions using t-SNE. I also had fun trying out {tricolore} to make the ternary colormap.
The interactive version with food labels (+ calorie and macronutrient information for each food) is on my website: https://www.gmschroeder.com/data_vis/macros-map/
Elias Dabbas :verified: · @elias
55 followers · 91 posts · Server seocommunity.social1/2
Happy to announce my course:
Data Science with Python for SEO 🎉 🎉 🎉
🔵 For absolute beginners
🔵 Make a leap in your data skills
🔵 Run, automate, and scale many SEO tasks with Python like crawling, analyzing XML sitemaps, text/keyword analysis
🔵 In depth intro to data manipulation and visualization skills
🔵 Get started with #advertools #pandas and #plotly
🔵 Make the transition from Excel to Python
🔵 Online, live, cohort-based, interactive
Elias Dabbas :verified: · @elias
55 followers · 90 posts · Server seocommunity.social
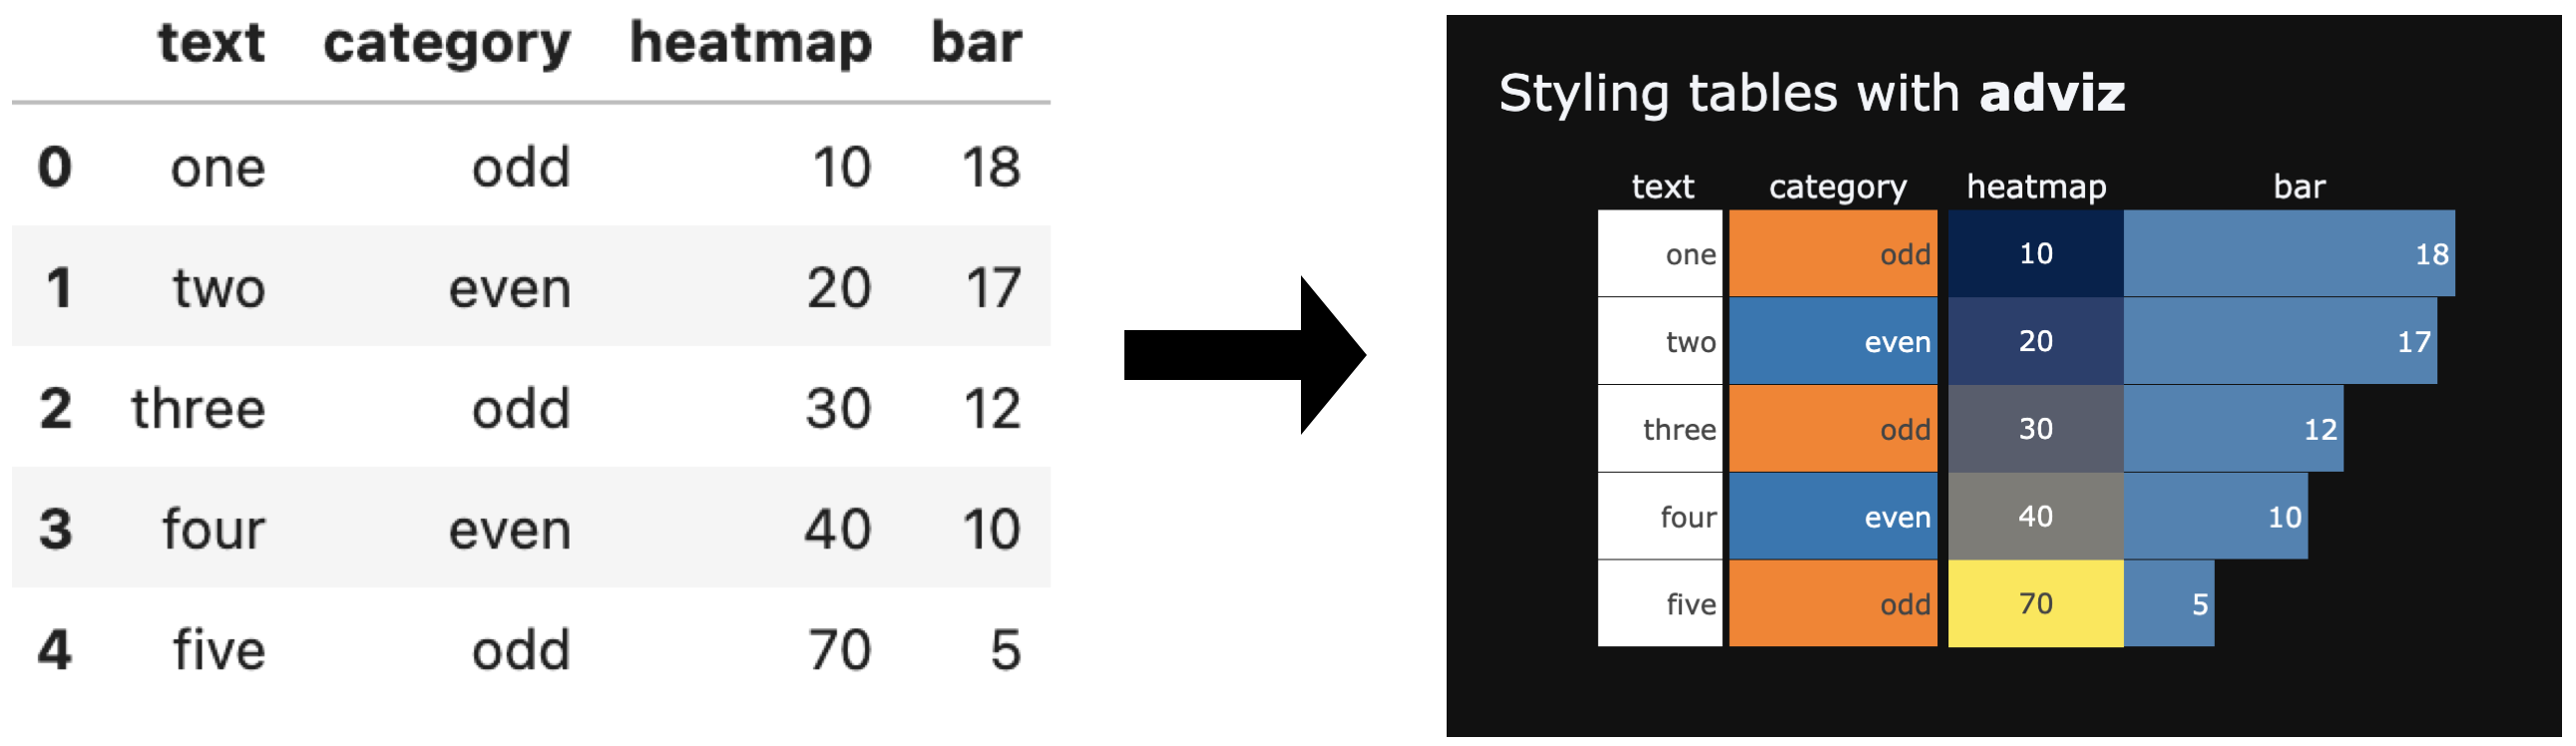
Styling tables with #adviz
New function/chart:
🔵 Style columns as text, category, bar, or heatmap
🔵 Set table title, width, height
🔵 Set relative column widths
🔵 Hover to see long text
🔵 HTML file
https://bit.ly/style_table
#DataScience #DataVisualization #Python #Plotly
#adviz #datascience #datavisualization #python #plotly

OpenAnalytics · @openanalytics
31 followers · 21 posts · Server fosstodon.org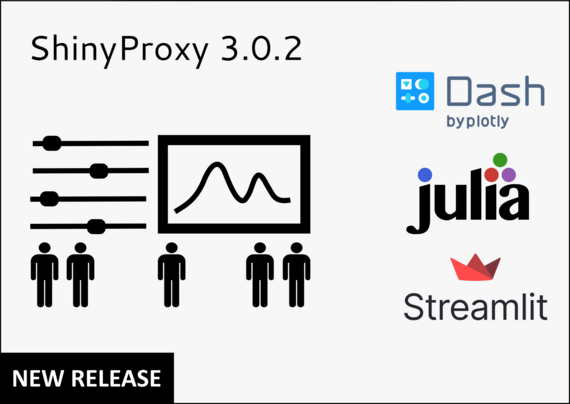
ShinyProxy now supports Dash.jl apps (for a demo: https://oa.eu/oujHVF) and #Streamlit apps (for a demo: https://oa.eu/LC8GsX).
Also, ShinyProxy’s mobile experience is improved, the support of admin users (next to admin groups) is added as well as passing of time zone information to your #datascience apps.
More information about the release: https://oa.eu/QN2Fbc
#streamlit #datascience #opensource #plotly #rstats #python #kubernetes

PyLadies Bot · @pyladies_bot
124 followers · 122 posts · Server botsin.space
📝 "Pills dataset - Part 2"
👤 Jennifer HY Lin (@jhylin)
🔗 https://jhylin.github.io/Data_in_life_blog/posts/09_Pills/Rust_polars_pills_df.html
#pyladies #python #dataanalyticsprojects #pillsdatasetseries #polars #plotly #jupyter
#pyladies #python #dataanalyticsprojects #pillsdatasetseries #polars #plotly #jupyter

Ploomber · @ploomber
26 followers · 21 posts · Server fosstodon.org
Unveiling a detailed walkthrough on visualizing #SQL queries with Plotly, a versatile #visualization library, using the #Ploomber package in our latest blog post.
Gain insights into the process from ground zero- starting with package installation, #data loading, creating, and loading tables onto a Python-SQL Jupyter Notebook, to the grand finale - visualizing data via various plots.
🔗 Google Colab: https://colab.research.google.com/github/ploomber/sql/blob/main/colabs/visualizing-your-sql-queries/plotting-with-plotly.ipynb
🔗 JupyterBook: https://ploomber-sql.readthedocs.io/en/latest/visualizing-your-sql-queries/plotting-with-plotly.html
#sql #visualization #ploomber #data #datavisualization #plotly
Elias Dabbas :verified: · @elias
55 followers · 81 posts · Server seocommunity.social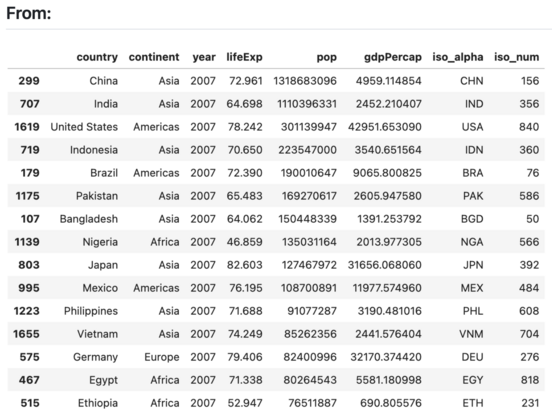
First steps at visualizing tables in a clear and (hopefully) beautiful way.
Get/edit the code here:
#DataScience #DataVisualization #Plotly #Barchart #Heatmap #Python
#datascience #datavisualization #plotly #barchart #heatmap #python
Ploomber · @ploomber
23 followers · 19 posts · Server fosstodon.org
The importance of data storytelling is growing in today's data-driven environment, and we have just the toolset to help you become top-tier data narrators - #SQL, #Seaborn, #Plotly, and #Matplotlib!
Learn more: https://ploomber-sql.readthedocs.io/en/latest/visualizing-your-sql-queries/types-of-visualizations.html
#sql #seaborn #plotly #matplotlib #datascience #datavisualization #python
Elias Dabbas :verified: · @elias
52 followers · 70 posts · Server seocommunity.social
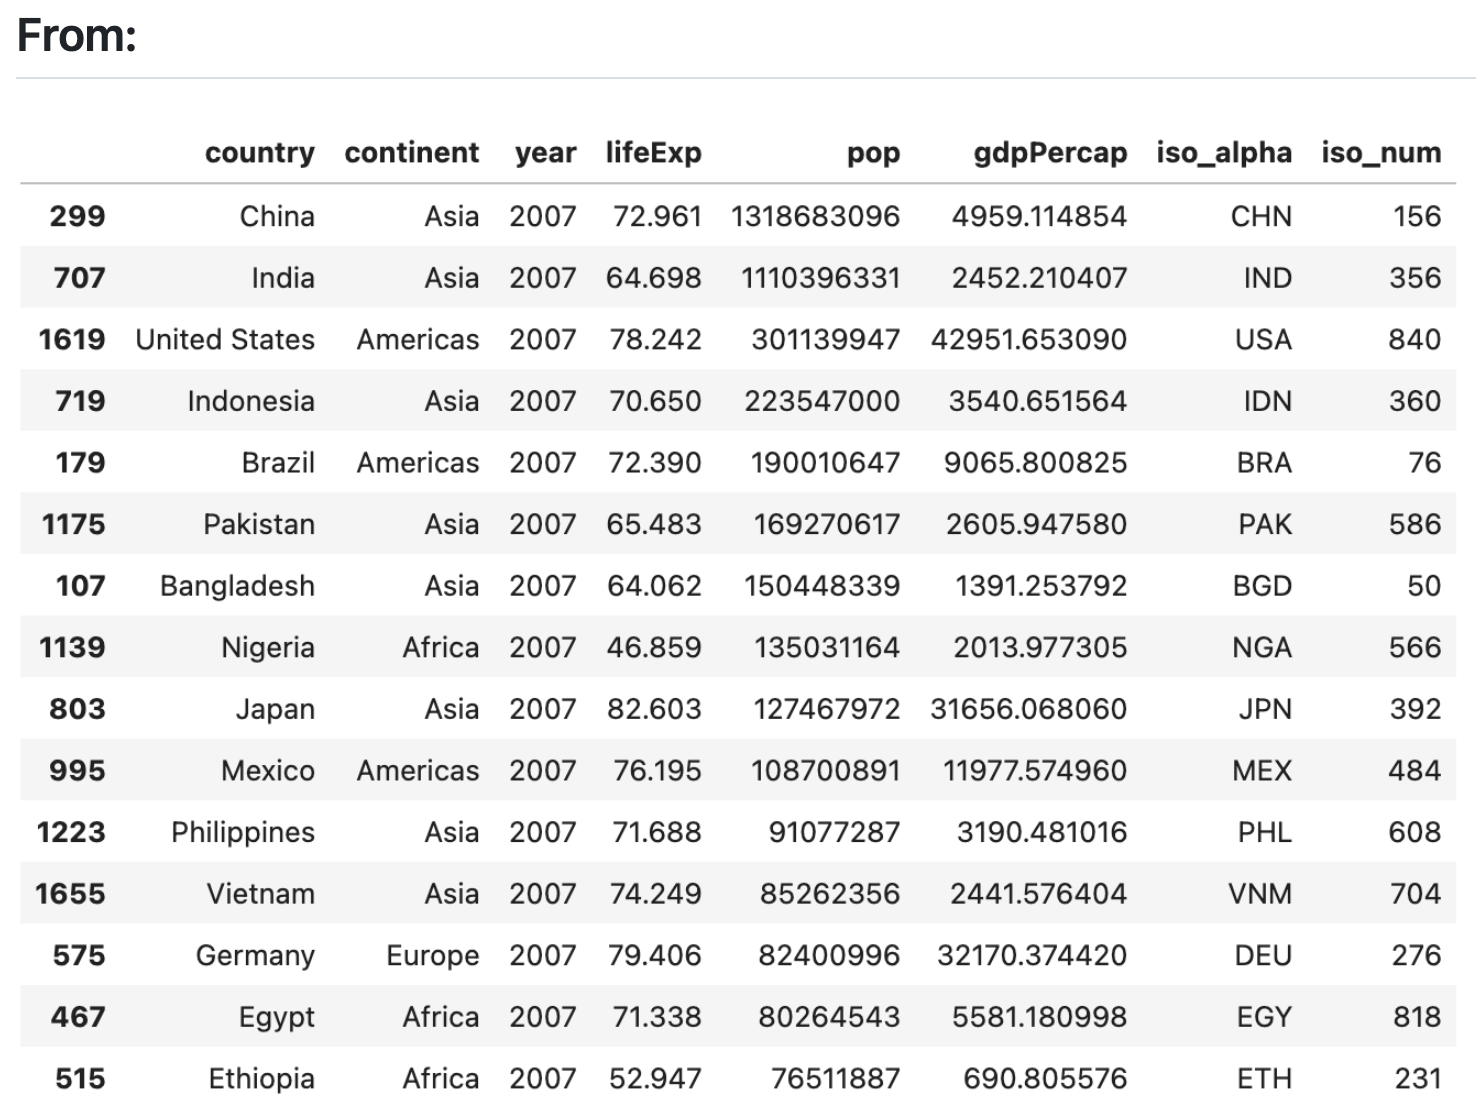
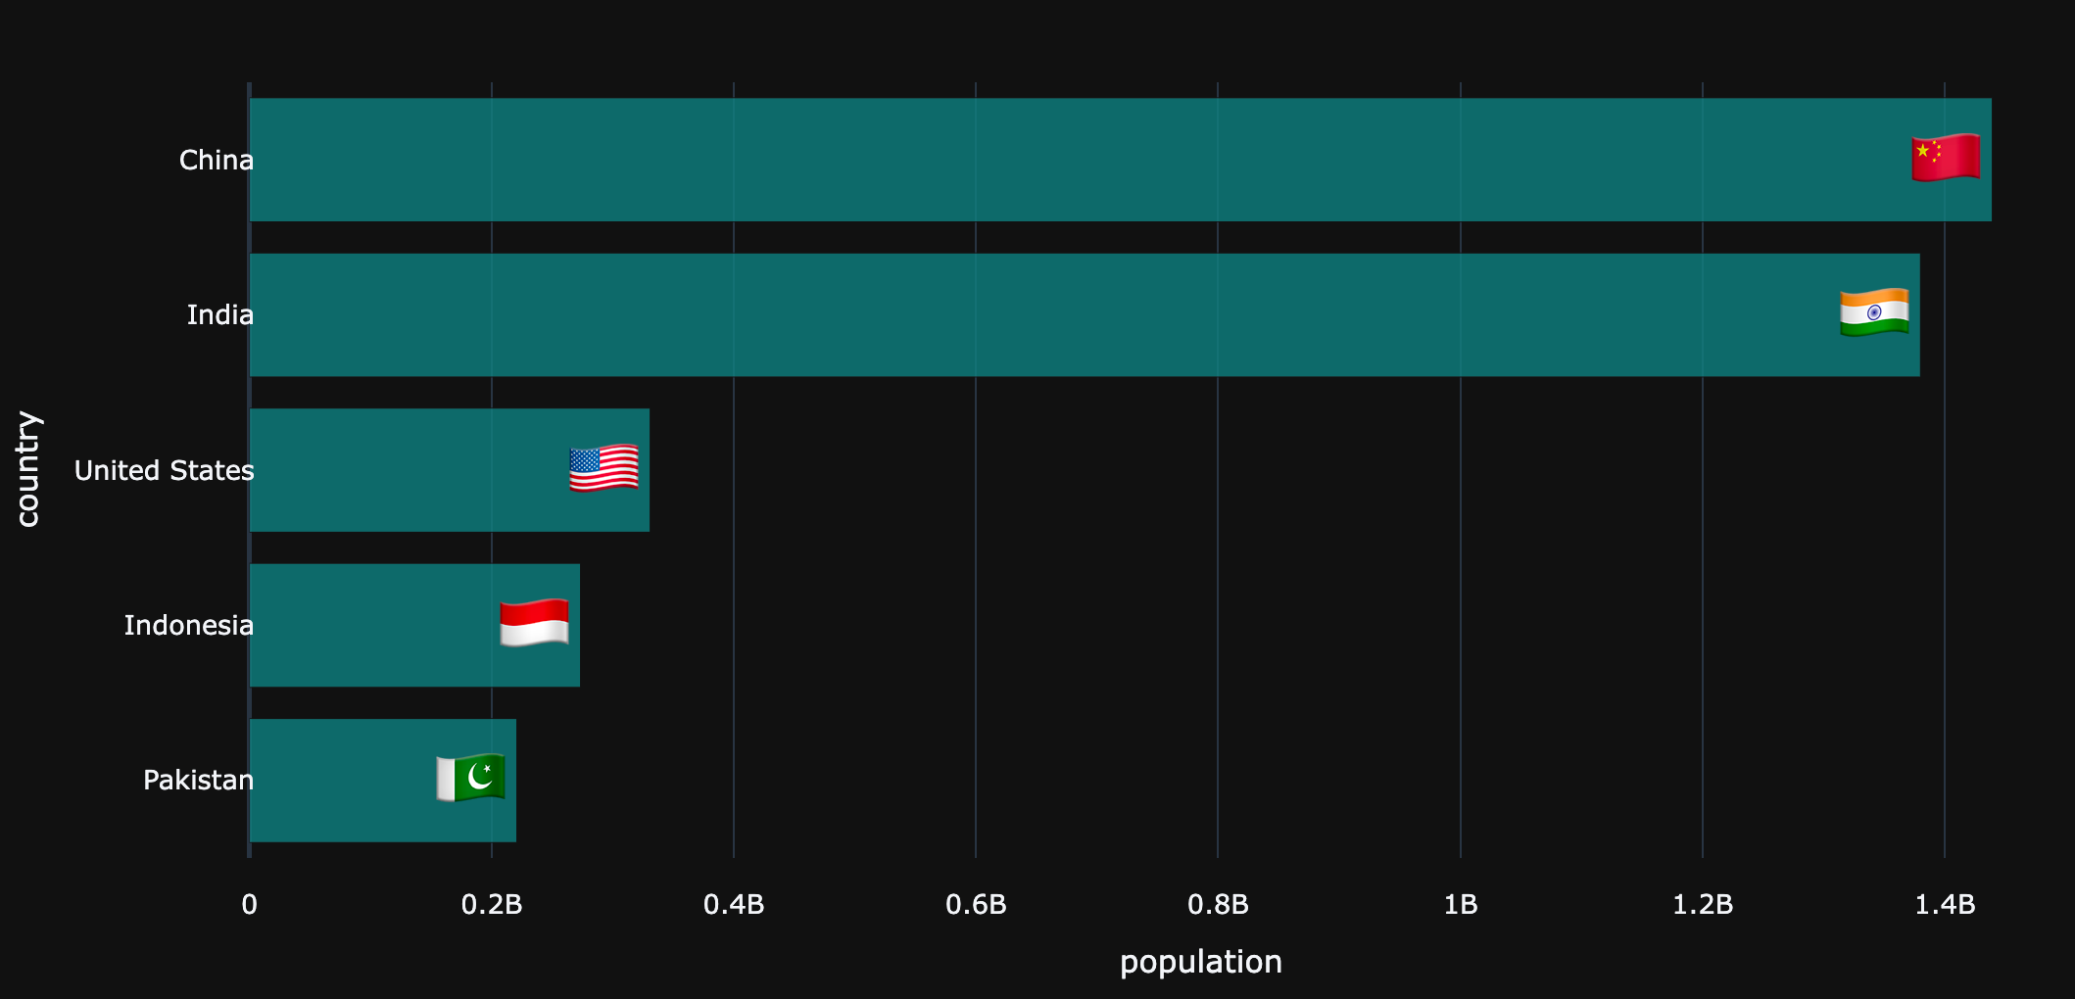
Country flags can make your charts/reports easier to read, & can give more space vs full country names.
Just released a simple new #adviz function flag() which converts a 2 or 3-letter country code or country name to its respective flag
python3 -m pip install --upgrade adviz
#adviz #advertools #datascience #datavisualization #python #plotly
PyLadies Bot · @pyladies_bot
99 followers · 91 posts · Server botsin.space
Anand Rao · @art
18 followers · 80 posts · Server mathstodon.xyz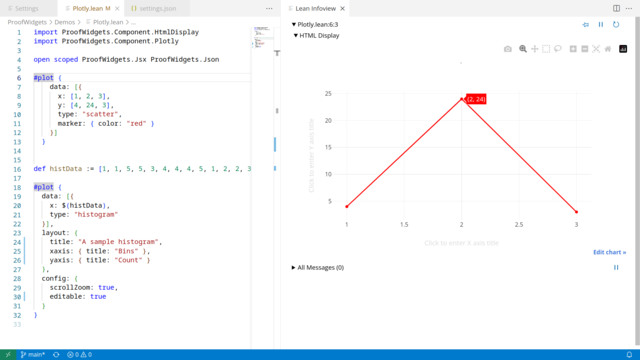
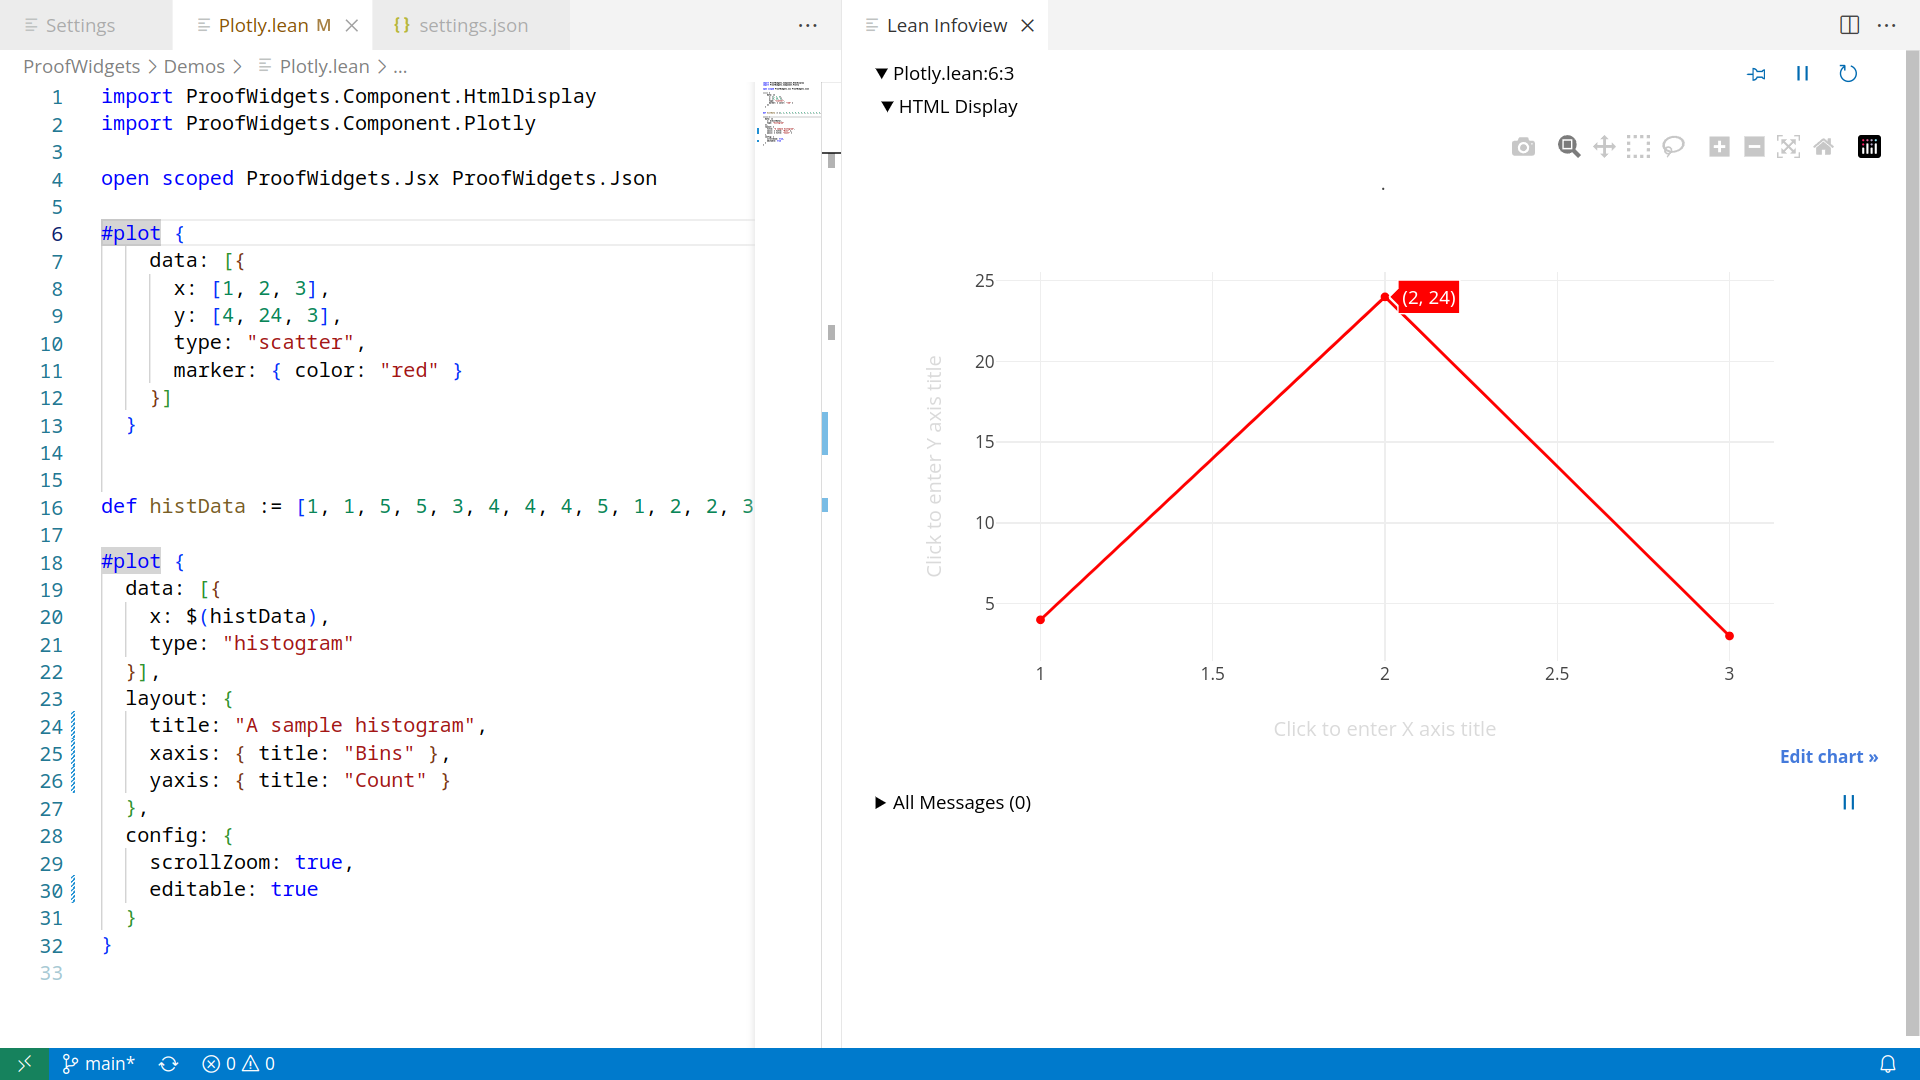
Generating interactive plots in the #Lean4 infoview using the #JavaScript #Plotly library through the fabulous #ProofWidgets framework (https://github.com/EdAyers/ProofWidgets4).
Source code available at https://github.com/0art0/ProofWidgets4/blob/main/ProofWidgets/Demos/Plotly.lean.
#proofwidgets #plotly #javascript #Lean4
PyLadies Bot · @pyladies_bot
94 followers · 80 posts · Server botsin.space
Madison Python · @madpy
39 followers · 39 posts · Server fosstodon.orgThis Thursday, join us for a workshop on visualizing data with #python, #streamlit, and #plotly. We'll have facilitators from the University of #Wisconsin #DataScience Hub lead us in a participatory workshop, building and customizing a demo app deployed onto the cloud. Bring your laptop!
https://www.meetup.com/madison-python/events/293265891/
Meeting at the #Madison library central branch. (No pizza this time. Sorry!)
#python #streamlit #plotly #wisconsin #datascience #madison