
Meghan Harris · @meghansharris
392 followers · 260 posts · Server fosstodon.org

gram · @orsinium
34 followers · 129 posts · Server fosstodon.org@bloom @washingtonpost I haven't seen these visualizations specifically, but I know a bit about making visualizations. In general, the most powerful and flexible way to generate graphics is the "grammar of graphics" idea coming from #ggplot2 from #rstats. In #python, there are two libraries that do it well: #plotnine and since this year also #seaborn. Both are good and have multiple nice themes, pick the one you like the most.
#ggplot2 #rstats #python #plotnine #seaborn

Seve_py :vim: :python: · @seve_py
15 followers · 240 posts · Server fosstodon.org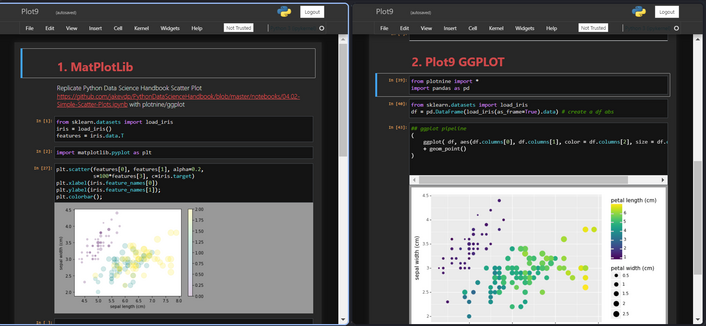
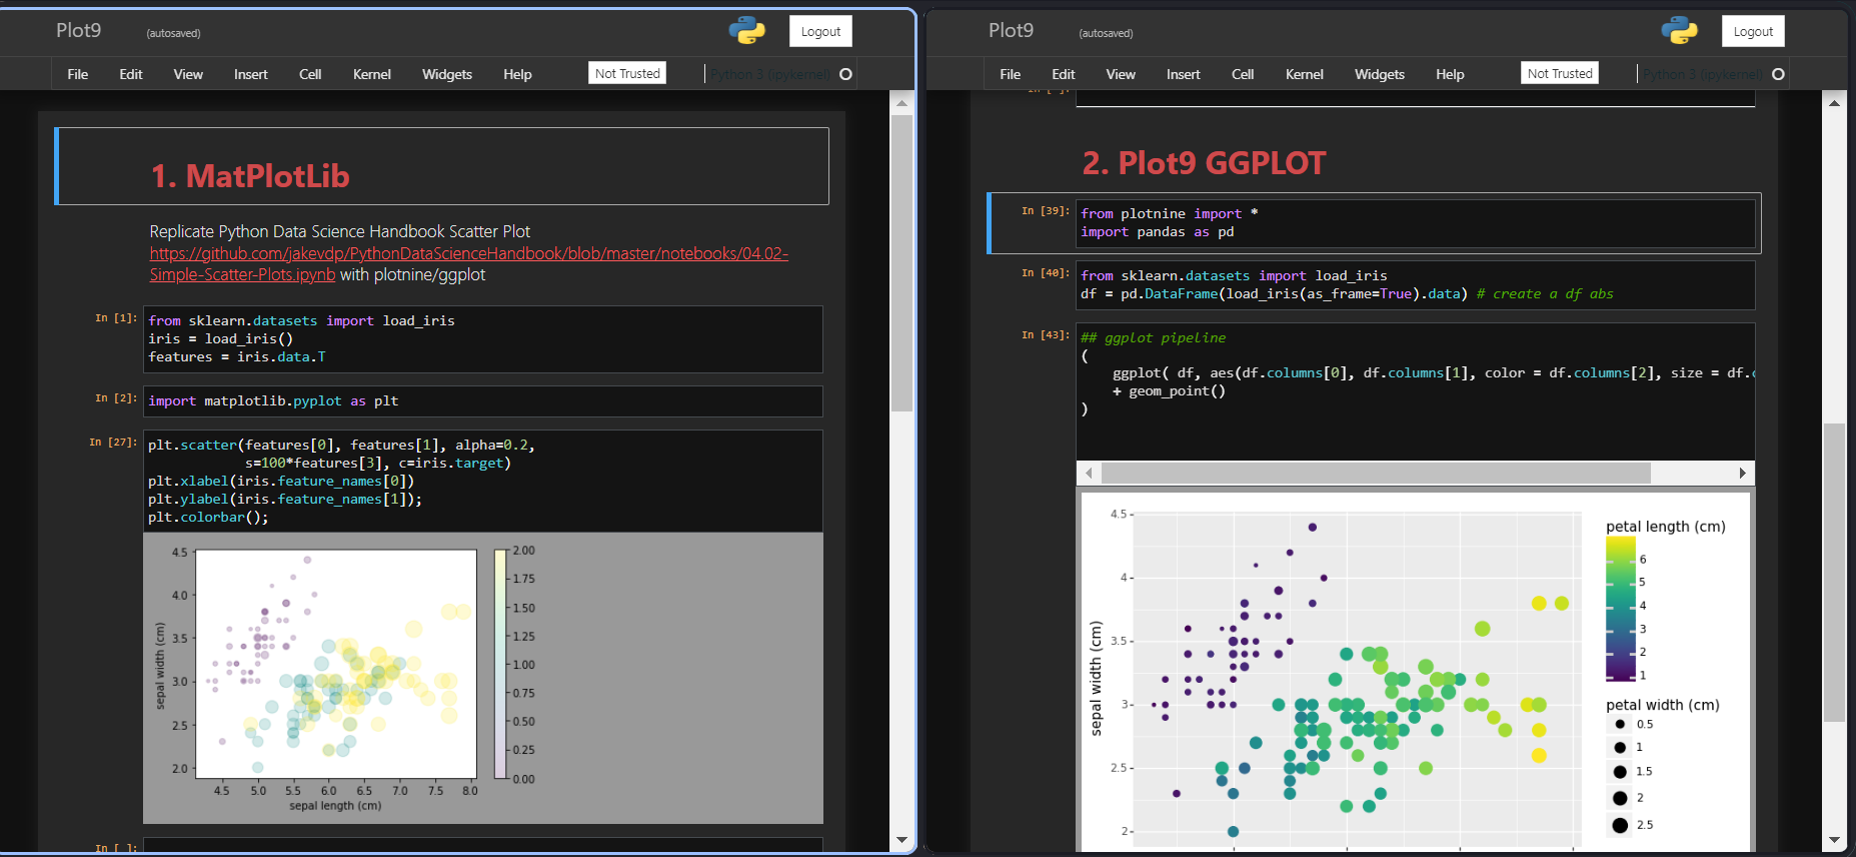
Replicate Python Data Science Handbook Scatter Plot https://github.com/jakevdp/PythonDataScienceHandbook/blob/master/notebooks/04.02-Simple-Scatter-Plots.ipynb with #python #plotnine #ggplot
Seve_py :vim: :python: · @seve_py
13 followers · 230 posts · Server fosstodon.orgReplicate Python Data Science Handbook Scatter Plot https://github.com/jakevdp/PythonDataScienceHandbook/blob/master/notebooks/04.02-Simple-Scatter-Plots.ipynb with #plotnine/#ggplot