
Maciej Beręsewicz · @beresewiczm
0 followers · 1 posts · Server fosstodon.org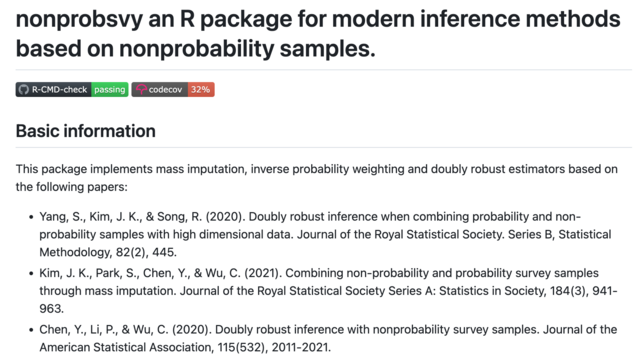
For all interested in #sampling #survey and #rstats I would like to endorse our new package: {nonprobsvy}. It implements state-of-the-art methods for #nonprobability samples published in top #stats journals (and many more!). Feel free to check it out! Development version can be found at https://github.com/ncn-foreigners/nonprobsvy
#sampling #survey #rstats #nonprobability #stats

Le Néandertal en a marre · @HydrePrever
1117 followers · 8092 posts · Server mathstodon.xyzIs there a classical regression model where, for 𝑖=1,…,𝑛,
𝐸(𝑌ᵢ) = 𝑁 𝑝ᵢ
with 𝑁 a known constant, and
𝑝ᵢ=(exp 𝑋ᵢ β) / (∑ⱼ exp 𝑋ⱼ β)
Thus 𝑝ᵢ ∈ (0,1) and ∑ 𝑝ᵢ = 1.
Note that this is *not* a multinomial logistic regression. There is a single vector β to estimate. It should be estimated from a single set of observations 𝑌₁,…,𝑌ₙ (and the covariates 𝑋₁,…, 𝑋ₙ).
#rstats #glm #statisticalmodel #statistics

Bruno Rodrigues :rstats: :tux: · @brodriguesco
1175 followers · 1886 posts · Server fosstodon.org
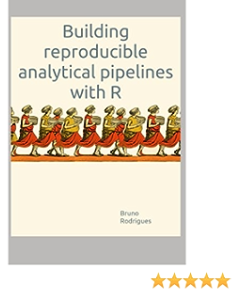
It's back to school so how about learning how to write #reproducible #datascience pipelines with #RStats ?
My book "Building reproducible analytical pipelines with #rstats" can help you with that!
Buy a drm-free epub or pdf @leanpub
https://leanpub.com/raps-with-r/
Physical copies are available https://amazon.com/dp/B0C87H6MGF (check your local market place)
Read for free forever: https://raps-with-r.dev
#reproducible #datascience #rstats

Benjamin Nowak · @bjnnowak
206 followers · 112 posts · Server fosstodon.org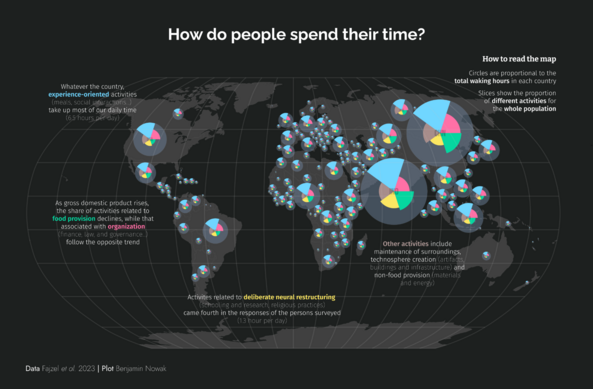
Our main activities are relatively similar between countries, with some differences depending on economic development (based on this week #TidyTuesday )
#RStats code: https://github.com/BjnNowak/TidyTuesday/blob/main/SC_HumanDat.R

coolbutuseless · @coolbutuseless
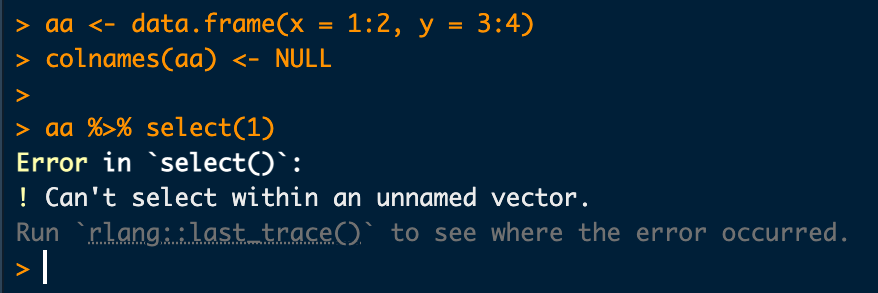
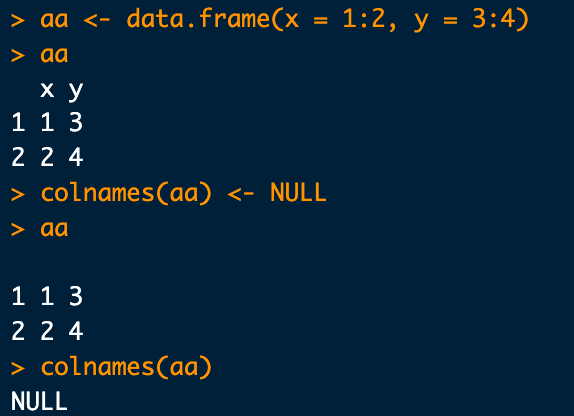
438 followers · 1362 posts · Server fosstodon.orgThis little side quest into unnamed data.frames was because {plotly} prepares data in unnamed data.frames in order to get {jsonlite} to output data in a particular JSON array format, rather than a JSON object format.
TIL.
coolbutuseless · @coolbutuseless
438 followers · 1361 posts · Server fosstodon.org
And {dplyr} won't let you select columns which don't have names.
Even if you're trying to select by numeric index
coolbutuseless · @coolbutuseless
438 followers · 1360 posts · Server fosstodon.org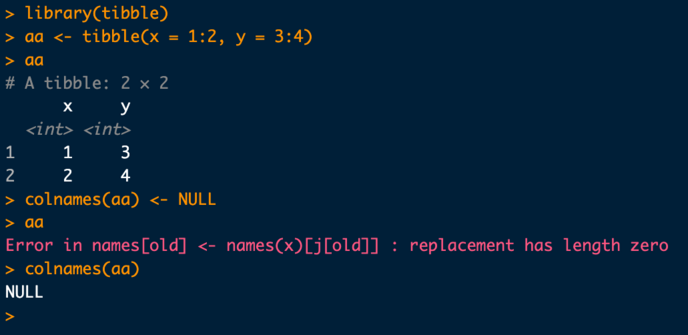
{tibble} will let colnames be set to NULL, but then has issues printing the tibble to console.
coolbutuseless · @coolbutuseless
438 followers · 1360 posts · Server fosstodon.org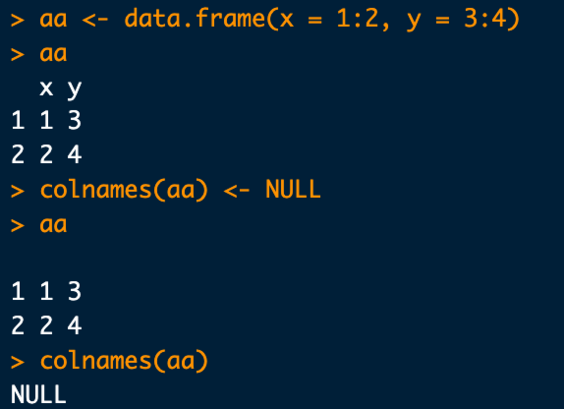
TIL: It is possible to have a data.frame without column names.
Not sure why you'd want to though...
coolbutuseless · @coolbutuseless
438 followers · 1360 posts · Server fosstodon.org@milesmcbain I'd appreciate only recycling for length = 1.
All other cases you have to do an explicit rep() / rep_along()

Andrew Heiss :rstats: · @andrew
3862 followers · 1546 posts · Server fediscience.org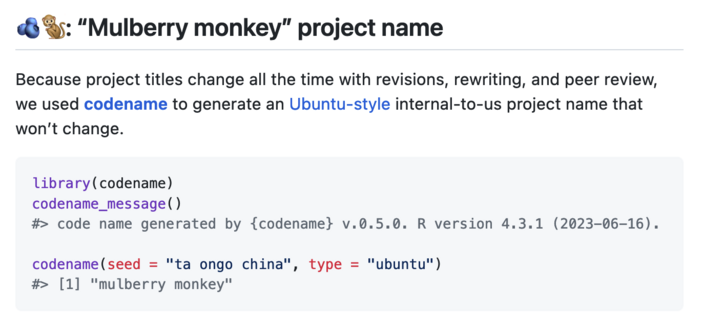
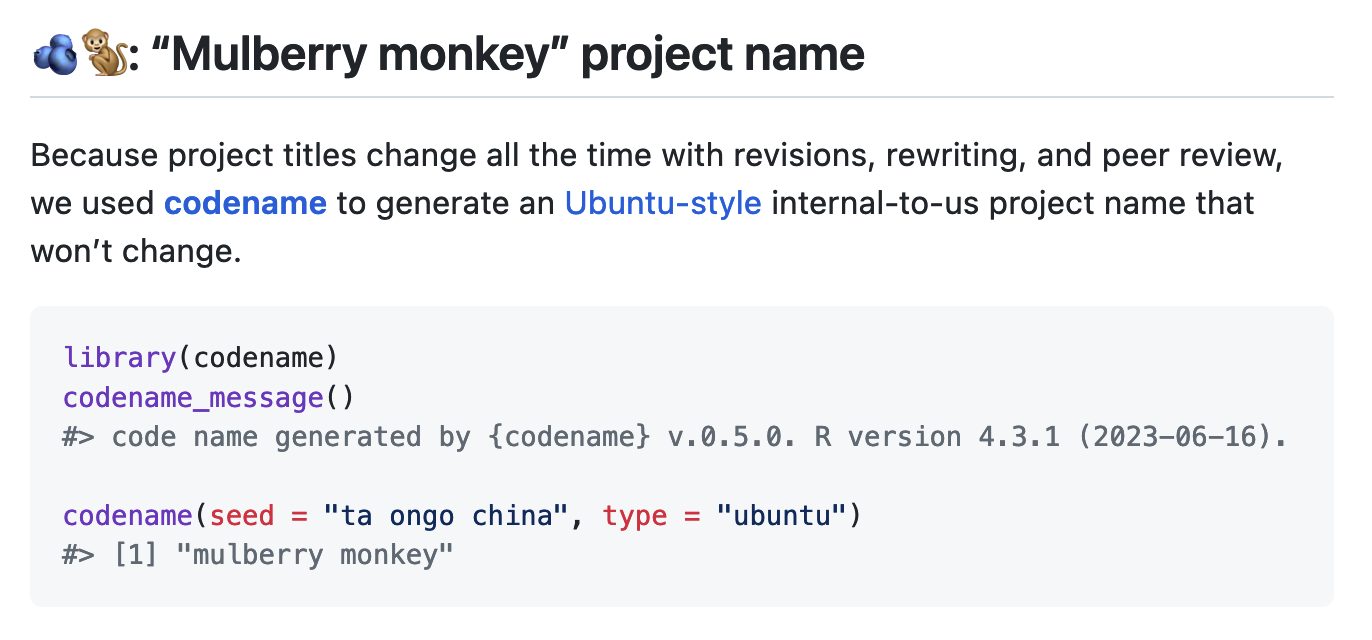
I think I just generated my favorite {codename} project name ever: "mulberry monkey" 🫐🐒 #rstats

MilesMcBain · @milesmcbain
1431 followers · 1214 posts · Server fosstodon.orgVector index recycling is convenient but it would be really great if #rstats core could sort it so that it plays a sound effect of some chimes tinkling when it’s happening so I know to check I want that magic right now. Next R sprint maybe? ✨🧙♂️🪄

Umair Durrani · @transportationtalk
28 followers · 85 posts · Server fosstodon.org
R Consortium · @RConsortium
306 followers · 89 posts · Server fosstodon.org
📢 R Consortium Pilot 3 Mileston 📢
Big news! R Submissions Working Group successfully submitted the pilot 3 R-based package to FDA eCTD on August 28, 2023. This is the first public R-centric FDA submission!
#rstats #fda #datascience #opensource

terence · @terence
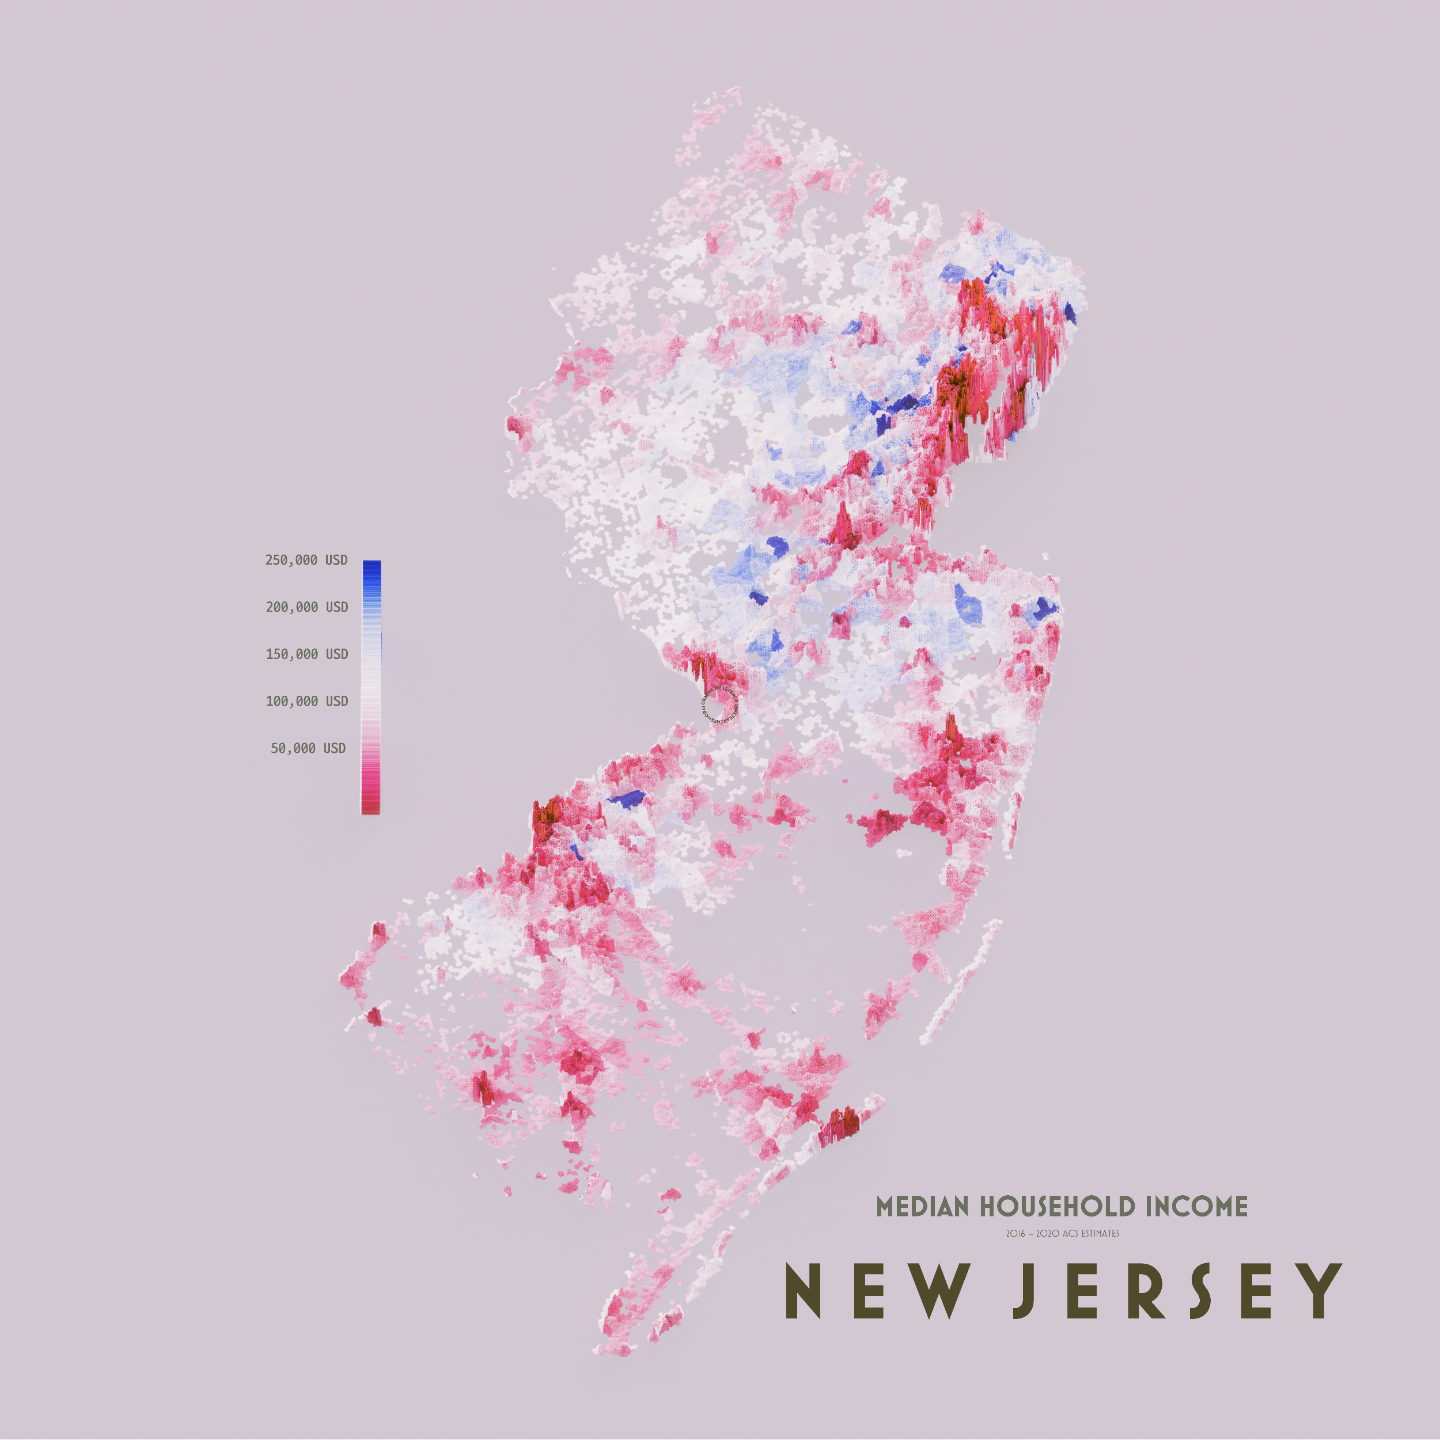
1858 followers · 355 posts · Server fosstodon.org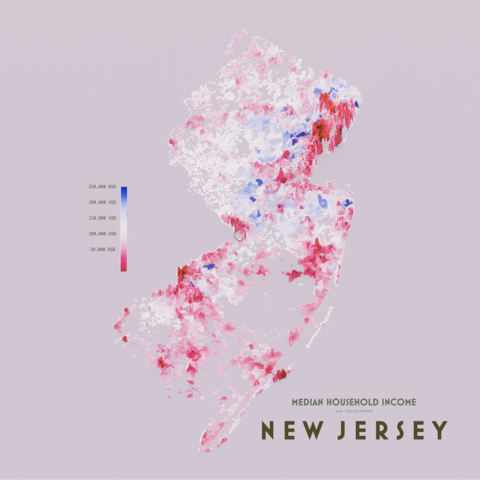
A map showing median household income of New Jersey, but this time by population (the previous one was census tract).
Higher spikes indicate greater population, colours indicate median income.

John MacKintosh · @johnmackintosh
487 followers · 1116 posts · Server fosstodon.orgOk, #rstats markdown avengers, assemble
Is there a way to extract specific options (namely fig.cap, tab.cap) from all the chunks in an RMarkdown document, export those to a text file, and then , assuming those options get edited externally by colleagues, read them back in again.
Trying to avoid tedious, tortuous and error prone copypasta between Word's track changes and my Rmd file..
Is this possible? If so, what's the best approach?

Simon Couch · @simonpcouch
489 followers · 118 posts · Server fosstodon.org
Feeling so, so stoked to see #rstats friends at posit::conf(2023) next week.🙂
Find me for a limited edition raspberry variant of the stacks hex.👀

Shannon Pileggi · @PipingHotData
1138 followers · 248 posts · Server fosstodon.org
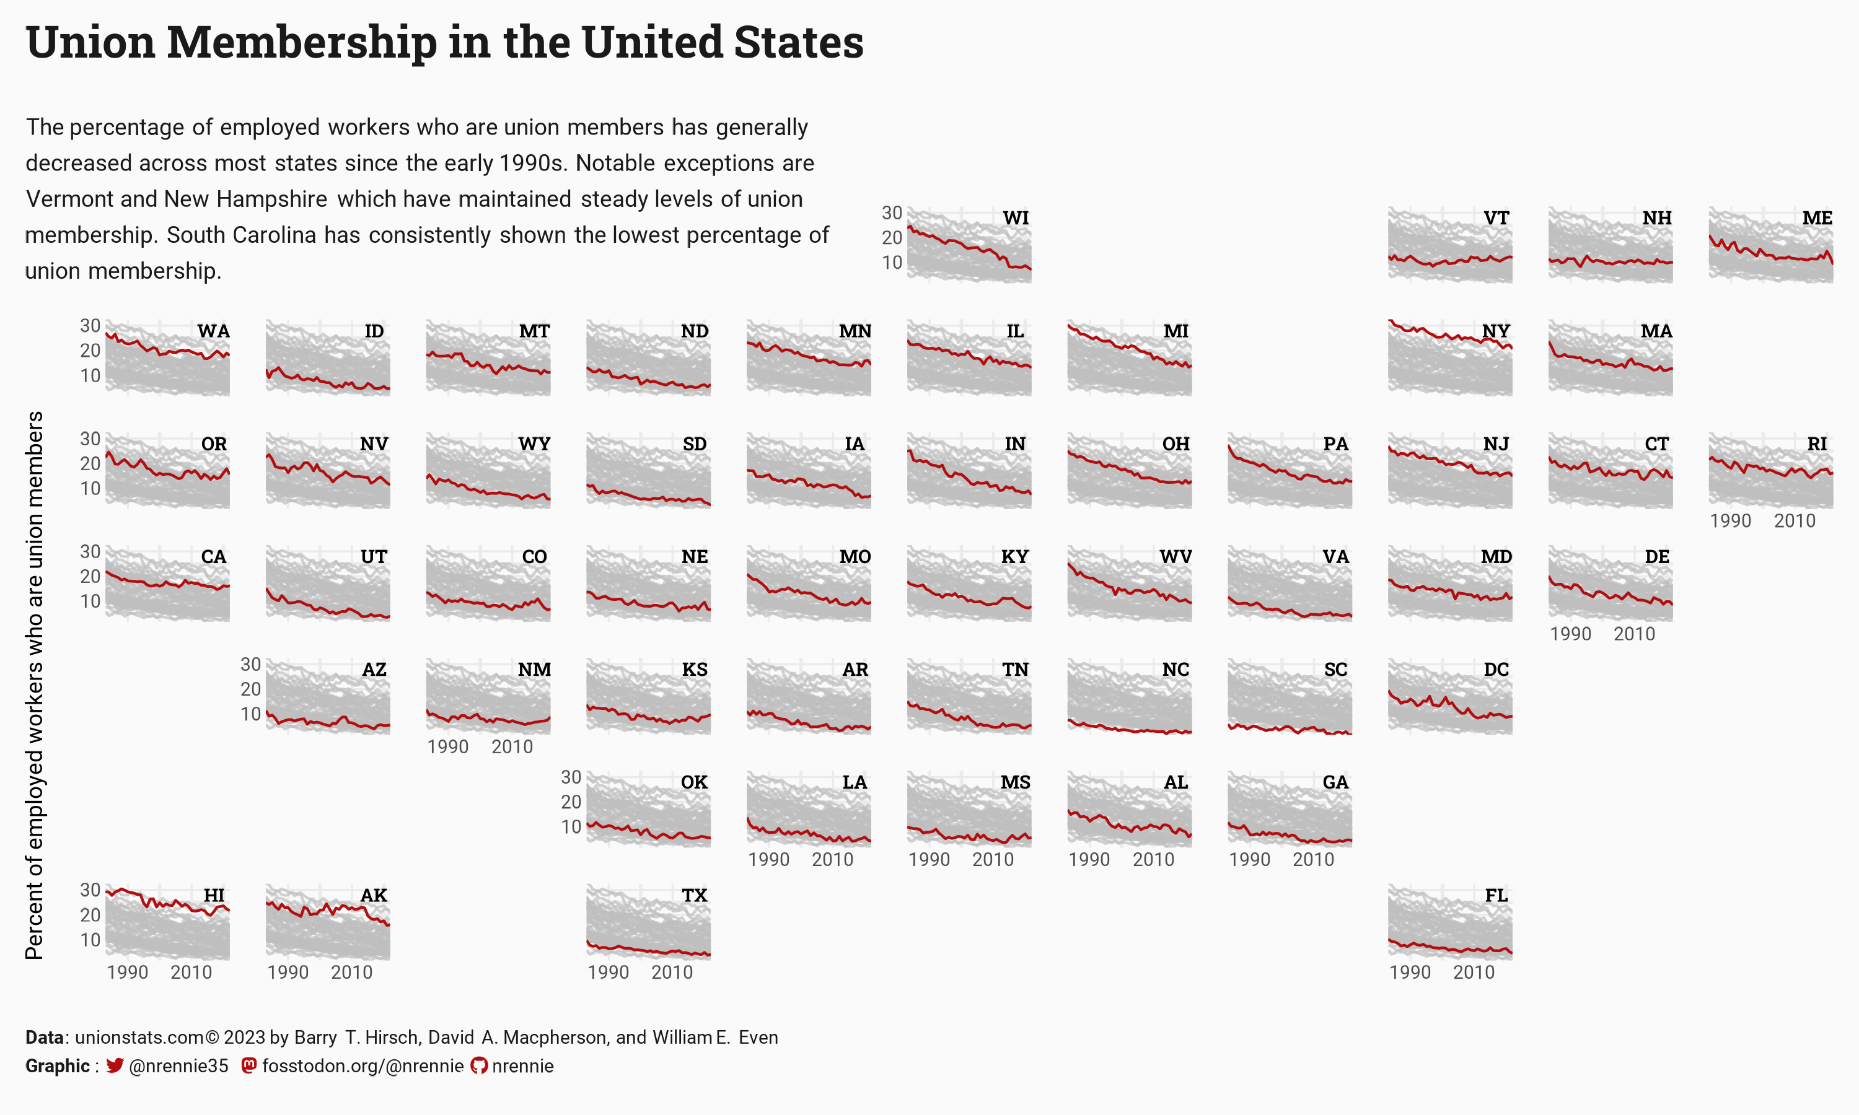
Nicola Rennie · @nrennie
1835 followers · 727 posts · Server fosstodon.org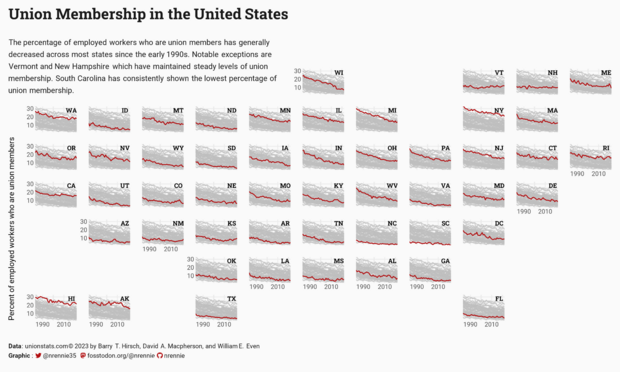
Catching up on last week's #TidyTuesday, and keeping it simple with some line charts! This plot uses two of my favourite #ggplot2 extension packages:
🗺️ {geofacet} for visualising data across different geographic regions
📈 {gghighlight} for highlighting a subset of values in a chart, here showing each state in relation to others
Code: https://github.com/nrennie/tidytuesday/tree/main/2023/2023-09-05
#tidytuesday #ggplot2 #rstats #dataviz #r4ds

Nic Crane · @nic_crane
274 followers · 37 posts · Server fosstodon.orgSo very very excited for posit::conf in a week or so! Can't wait to meet up with so many of my favourite #rstats folks, and meeting loads of new ones too 😍
terence · @terence
1857 followers · 354 posts · Server fosstodon.org
#geobr and #censob by @UrbanDemog are terrific #rstats packages! Saw a fun vignette and thought I try making it 3D because why not? Gratuitous, possibly. Pretty, I think so.
Here's the proportion of households in Brasil connected to a sewage network in 2010.