LabPlot · @LabPlot
394 followers · 44 posts · Server floss.social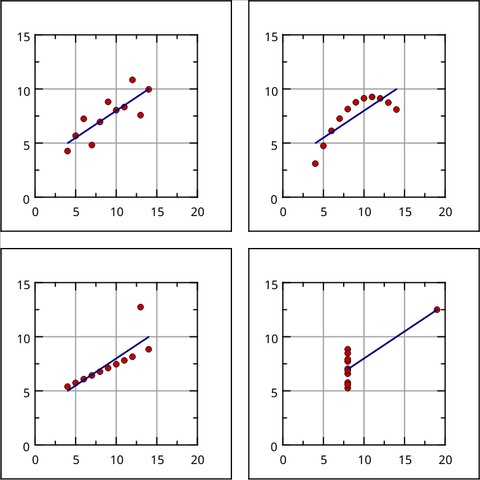
If you are interested, please see also this thread on the importance of visualizing data (the Anscombe's quartet, Simpson's paradox are also included in @LabPlot):
https://mstdn.social/@onemoment/109692198312380103
#Anscombe #SimpsonsParadox #DatasaurusDozen #Visualization #DataViz
#anscombe #simpsonsparadox #datasaurusdozen #visualization #dataViz

Onemoment · @onemoment
13 followers · 41 posts · Server mstdn.social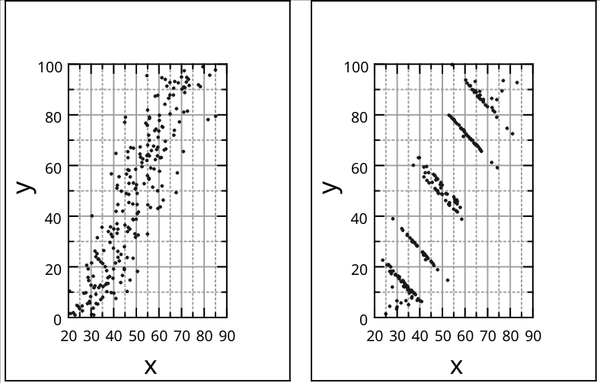
The importance of visualizing data. Part 3.
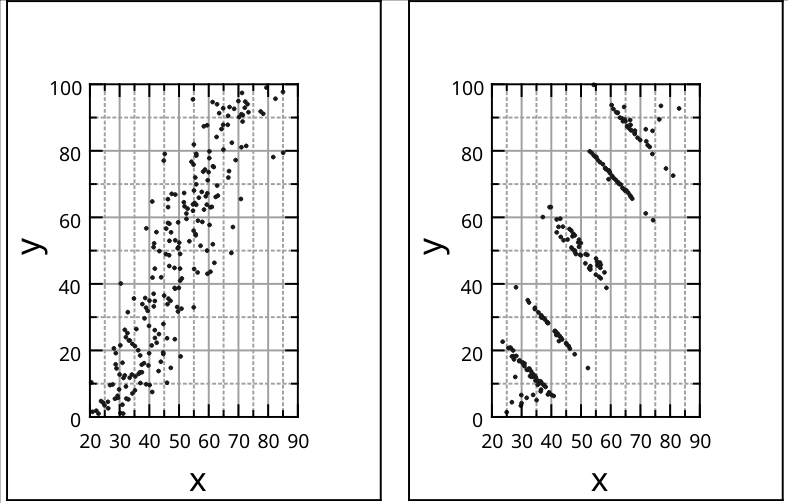
Simpson's paradox is a phenomenon in statistics in which a trend appears in several groups of data but disappears or reverses when the groups are combined.
https://en.wikipedia.org/wiki/Simpson%27s_paradox
The example is available in @LabPlot via File > Open Example.
#LabPlot #OpenSource #DataViz #Visualization #Statistics #DataAnalysis #SimpsonsParadox
#simpsonsparadox #dataanalysis #statistics #visualization #dataviz #OpenSource #labplot

Elizabeth Wrigley-Field · @wrigleyfield
757 followers · 115 posts · Server fediscience.org@tao Thanks for this example! Great mash-up of #SimpsonsParadox and #LengthBiasedSampling
#lengthbiasedsampling #simpsonsparadox

Scott Robeson · @indianaclimate
314 followers · 64 posts · Server fediscience.org
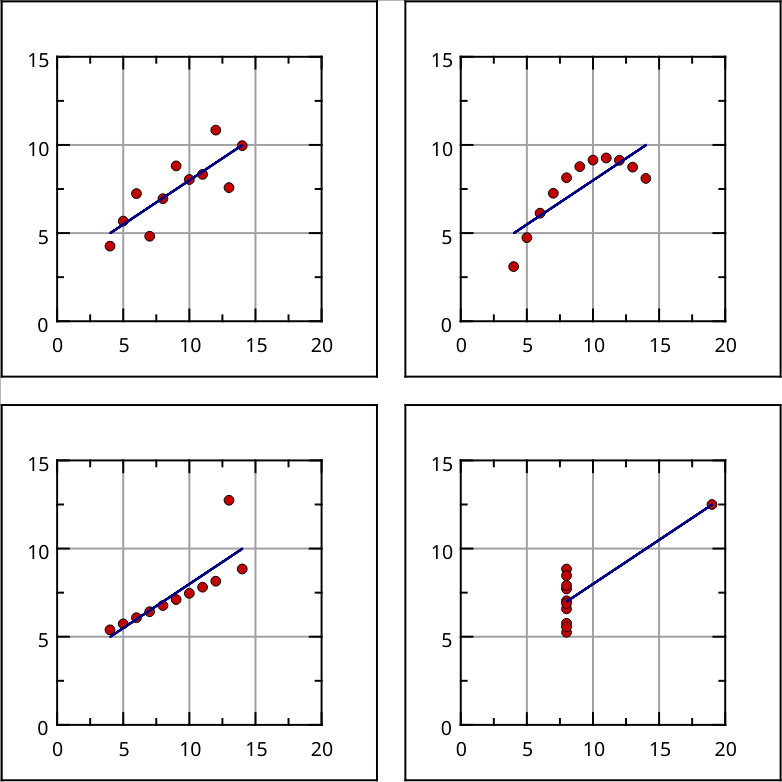
Have you heard of Simpson's Paradox?
It occurs when the relationship between variables is vastly different when the population is divided into subgroups.
https://en.wikipedia.org/wiki/Simpson%27s_paradox
This happens in various contexts and, in replying to an e-mail yesterday, I realized that it also applies to data that are analyzed spatially or temporally or when those two are pooled. Kinda cool if you're into that sort of thing. 😉