Tom Zijlstra · @tomzijlstra
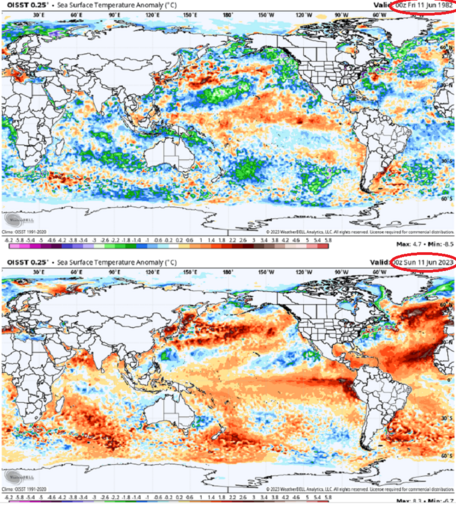
9 followers · 311 posts · Server mastodon.nlhttps://sailing-dulce.nl/home/article-8134 #oceanwarming #SO2 #ElNiño Dinsdag 13-06-2023 Dit is beslist geen alarmisme, het is allemaal echt. De Amerikaanse klimatoloog Jeff Berardelli (Cornell University) plaatst in een tweet een vergelijking van twee dagen wat betreft oceaantemperaturen in de aanloop tot de nieuwe El Niño: 11 juni 1982, toen er een super El Niño in ontwikkeling was, en van jongstleden 11 juni 2023 - met de nieuwe El Niño in aantocht. Een onthutsende vergelijking..
CREA Clean Air · @CREACleanAir
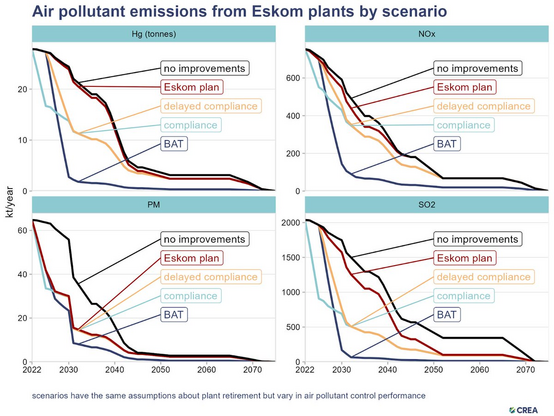
161 followers · 210 posts · Server masto.aiEskom’s retrofit plan only realizes one quarter of the health benefits associated with compliance with South Africa's Minimum Emissions Standards (MES), due to the almost complete failure to address #SO2 #emissions.
CREA Clean Air · @CREACleanAir
161 followers · 207 posts · Server masto.ai📢 🇿🇦 NEW
CREA report finds Eskom's failure to comply with #SouthAfrica's emission standards for #coal power plants would cause 34,000 deaths & health costs of USD 32 bn.
⚠️ #Eskom is now largest power sector emitter of #SO2 in the world, surpassing retrofitted Chinese utilities. 👇
#southafrica #coal #eskom #so2
anlomedad · @anlomedad
409 followers · 811 posts · Server mst.mineown.de40% of worldwide shipping is shipping fossil fuels around the globe.
And Europe is increasing this "CO2 shipment to the atmosphere" now by replacing pipelined gas with shipped LNG.
Someone has probably done the maths for the climate load of this significant change?
I'd be interested, you too?
Shipped #LNG overall should cause fewer #methane #leaks than pipelined gas (at least overland?), I guess.
And contrary to pipelined gas, shipped LNG causes #SO2 and #NOx. Both are coolants. NOx by way of tropospheric ozone and then OH radicals which bomb #CH4 molecules to bits.
So the embedded short-term, 10-year, climate-load of shipped LNG should be smaller than that of pipelined gas. Much smaller.
The increased bombing of CH4 molecules by additional OH radicals seems to me a very desirable side effect of Putler's war on #Ukraine, seeing that the OH sink is suspected to be in decline recently.
A decline, maybe as side effect of pandemic-induced less NOx which decreased shipping and reduced road traffic.
#lng #methane #leaks #so2 #nox #ch4 #ukraine
🇺🇸 Bewickwren 🇵🇹 · @Bewickwren
374 followers · 3206 posts · Server toot.communitySulfur dioxide (#SO2) emission rates of approximately 120,000 tonnes per day (t/d) were measured on December 4, 2022, and remain elevated at this time even in #NewMexico
The International Volcanic Health Hazard Network has detailed information about vog: https://vog.ivhhn.org/
#so2 #newmexico #maunaloa #airquality
Mark Parrington · @m_parrington
587 followers · 144 posts · Server airpollution.science#CopernicusAtmosphere Monitoring Service #ECMWF total column sulphure dioxide #SO2 analyses, based on the assimilation of GOME-2 and TROPOMI 🛰️ observations showing the transport of the plume following the eruption of #MaunaLoa 🌋 #Hawaii across the Pacific, North America and the Atlantic between 28 November and 5 December.
Read our updated article at https://atmosphere.copernicus.eu/cams-monitors-so2-mauna-loa-volcano-awakens-first-time-40-years
Access the data at https://ads.atmosphere.copernicus.eu/cdsapp#!/dataset/cams-global-atmospheric-composition-forecasts?tab=overview
#copernicusatmosphere #ecmwf #so2 #maunaloa #hawaii #volcano #atmosphere #atmoschem #earthobservation
ADAM platform · @adamplatform
62 followers · 6 posts · Server mapstodon.spaceFrom #Pacific to #Atlantic: #Maunaloa #volcano eruption updating!
The plume of #SO2 crossed the #USA reaching #Caribbean, as showed in the #Copernicus #Sentinel5p image on Dec. 2nd.
#pacific #atlantic #maunaloa #volcano #so2 #usa #caribbean #Copernicus #Sentinel5P #maunaloaeruption #hawaii #airquality
Raphael Grandin · @RaphaelGrandin
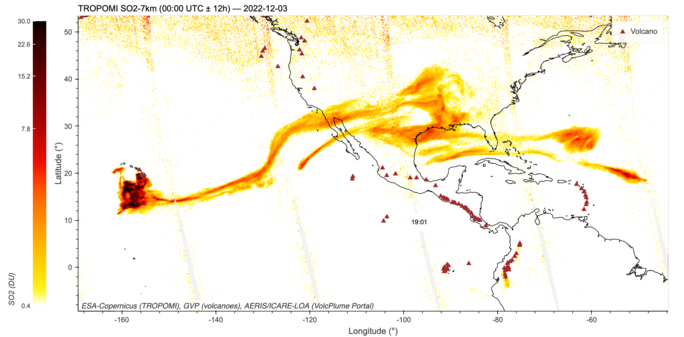
204 followers · 146 posts · Server social.linux.pizzaSulfur dioxide (SO2) plume emitted by #maunaloa #volcano continues to spread above North America.
Images acquired on 02 and 03 Dec 2022.
#Hawaii #Volcano #eruption #lavaflow #maunaloa #lava #Geology #TROPOMI #Copernicus #Sentinel5P #so2 #satellite #remotesensing
#remotesensing #satellite #so2 #Sentinel5P #copernicus #Tropomi #geology #lava #LavaFlow #eruption #hawaii #volcano #maunaloa
Mark Parrington · @m_parrington
544 followers · 130 posts · Server airpollution.science#CopernicusAtmosphere Monitoring Service #ECMWF total column #SO2 5-day forecast from 2 December 00 UTC showing the plume with very high values (white areas > 10 DU) from the #MaunaLoa 🌋 Hawaii eruption already crossing southern US/northern Mexico as far as the Atlantic and recirculating over the Caribbean early next week. Layer height observations show the plume at ~8 km altitude.
Read more at https://atmosphere.copernicus.eu/cams-monitors-so2-mauna-loa-volcano-awakens-first-time-40-years
#copernicusatmosphere #ecmwf #so2 #maunaloa #atmoschem #atmosphere #earthobservation #volcano
Mark Parrington · @m_parrington
521 followers · 115 posts · Server airpollution.science#CopernicusAtmosphere Monitoring Service #ECMWF total column #SO2 5-day forecast from 30 November 00 UTC showing larger area of the plume from the #MaunaLoa 🌋 Hawaii eruption being transported eastwards across the Pacific. Some filaments reach the US in the next few days and will become clearer as more GOME-2 & #TROPOMI 🛰️ observations are assimilated in coming days.
Read more at https://atmosphere.copernicus.eu/cams-monitors-so2-mauna-loa-volcano-awakens-first-time-40-years
#copernicusatmosphere #ecmwf #so2 #maunaloa #tropomi #atmoschem #atmosphere #earthobservation
Raphael Grandin · @RaphaelGrandin
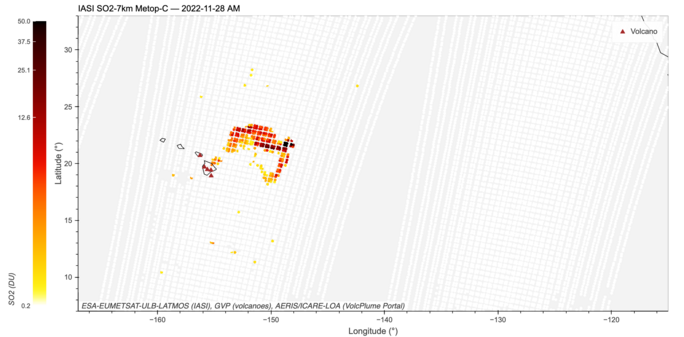
203 followers · 145 posts · Server social.linux.pizzaHere is the IASI imagery captured on 28 Nov 2022 from Metop-C (around 20:00 UTC).
Estimated plume height reached 16 km (to be confirmed).
Source of #dataviz: VolcPlume portal (c) AERIS / ICARE / LOA.
#Hawaii #Volcano #eruption #lavaflow #maunaloa #lava #Geology #IASI #satellite #remotesensing #SO2 #dataviz
#so2 #remotesensing #satellite #Iasi #geology #lava #maunaloa #LavaFlow #eruption #volcano #hawaii #dataviz
Raphael Grandin · @RaphaelGrandin
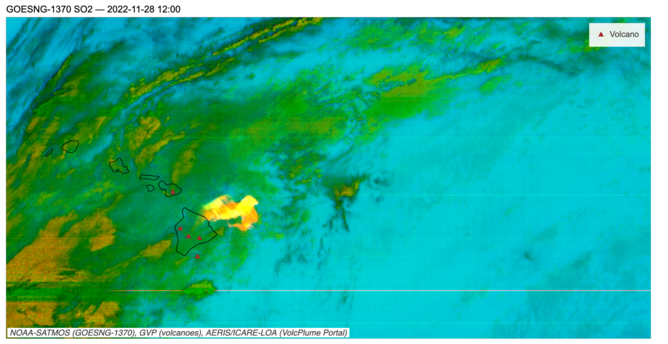
190 followers · 136 posts · Server social.linux.pizzaSulfur dioxide (SO2) RGB composition of the 28 Nov 2022 Mauna Loa (Hawaii) eruption from GOESNG -137° geostationary imagery.
Full animation (MP4) here: https://peertube.virtual-assembly.org/videos/watch/3cc8a340-d2a1-4c91-9a61-e578ce9fdc73
Sampling rate: 1 image every 30 minutes.
Source of animation: VolcPlume portal (c) AERIS / ICARE / LOA.
Data: NOAA / SATMOS.
#Hawaii #Volcano #eruption #lavaflow #maunaloa #lava #Geology #GOES #satellite #remotesensing #SO2 #dataviz
#dataviz #so2 #remotesensing #satellite #goes #geology #lava #maunaloa #LavaFlow #eruption #volcano #hawaii
Raphael Grandin · @RaphaelGrandin
190 followers · 136 posts · Server social.linux.pizzaAnimation showing sulfur dioxide RGB composition of the 28 Nov 2022 Mauna Loa (Hawaii) eruption from GOESNG -137° geostationary imagery.
Sampling rate: 1 image every 30 minutes.
Source of animation: VolcPlume portal (c) AERIS / ICARE / LOA.
Data: NOAA / SATMOS.
#Hawaii #Volcano #eruption #lavaflow #maunaloa #lava #Geology #GOES #satellite #remotesensing #SO2 #dataviz
https://peertube.virtual-assembly.org/videos/watch/3cc8a340-d2a1-4c91-9a61-e578ce9fdc73
#dataviz #so2 #remotesensing #satellite #goes #geology #lava #maunaloa #LavaFlow #eruption #volcano #hawaii
Raphael Grandin · @RaphaelGrandin
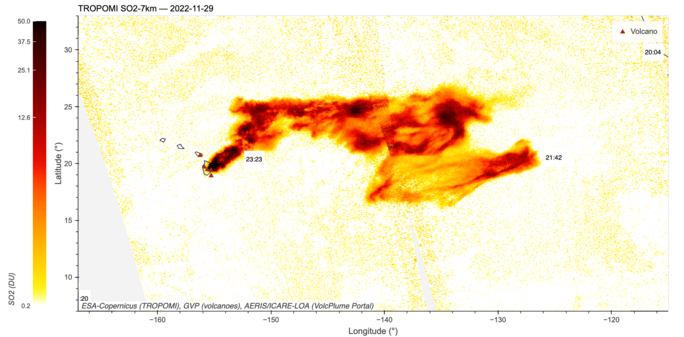
189 followers · 133 posts · Server social.linux.pizzaMauna Loa eruption: massive SO2 (sulfur dioxide) plume imaged by Sentinel-5P TROPOMI.
Maximum = 200 DU close to the source.
Total estimated SO2 mass > 100 kton (#USGS reports a flux of "250 kton / day SO2").
Image acquired around 22:00 UTC on 29 Nov.
Source: VolcPlume portal (c) AERIS / ICARE / LOA https://www.aeris-data.fr/le-projet-volcplume-une-plateforme-unique-pour-le-suivi-et-lanalyse-4d-des-panaches-volcaniques/
#Hawaii #Volcano #eruption #lavaflow #maunaloa #lava #Geology #TROPOMI #satellite #Sentinel5P #remotesensing #SO2 #dataviz
#dataviz #so2 #remotesensing #Sentinel5P #satellite #Tropomi #geology #lava #maunaloa #LavaFlow #eruption #volcano #hawaii #usgs
AI6YR · @ai6yr
1509 followers · 1522 posts · Server m.ai6yr.orgMark Parrington · @m_parrington
497 followers · 97 posts · Server airpollution.scienceAnimation of the #CopernicusAtmosphere Monitoring Service total column #SO2 forecast initialized on 29 November at 00 UTC. Assuming an initial injection height of approximately 5km from the eruption of #MaunaLoa, the plume is predicted to be advected eastwards before dissipating. New observations will be assimilated in later forecasts.
More on our monitoring of this eruption can be found at https://atmosphere.copernicus.eu/cams-monitors-so2-mauna-loa-volcano-awakens-first-time-40-years
Access the #OpenData analyses and forecasts at https://ads.atmosphere.copernicus.eu/cdsapp#!/dataset/cams-global-atmospheric-composition-forecasts?tab=overview
#copernicusatmosphere #so2 #maunaloa #opendata
Mark Parrington · @m_parrington
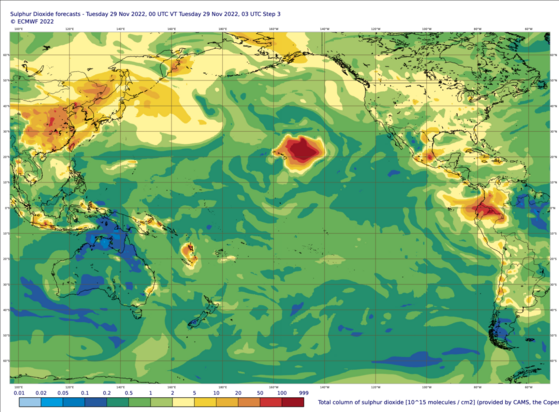
496 followers · 95 posts · Server airpollution.scienceTotal column sulphur dioxide #SO2 from the eruption of #MaunaLoa 🌋 #Hawaii in the #CopernicusAtmosphere Monitoring Service analysis & forecast from 29 Nov 00 UTC based on assimilation of GOME-2🛰️ observations assuming an initial injection height at approximately 5 km. Latest forecast charts can be found at https://atmosphere.copernicus.eu/charts/cams/sulphur-dioxide-forecasts?facets=undefined&time=2022112900,3,2022112903&projection=classical_pacific&layer_name=composition_so2_totalcolumn
Read more on how we monitoring volcanic SO2 in https://atmosphere.copernicus.eu/solving-challenges-modelling-volcanic-eruptions
#so2 #maunaloa #hawaii #copernicusatmosphere #atmoschem #earthobservation #atmosphere #airquality
Dr. Alexandre Santerne 🌍 · @AlexSanterne
1460 followers · 838 posts · Server astrodon.socialFrom these exquisite-precision data, we can identify many different species with a very high significance:
✅ #sodium (#Na)
✅ #potassium (#K)
✅ #water (#H2O)
✅ #hydrogen #sulfide (#H2S)
✅ #carbon #dioxide (#CO2)
✅ #methane (#CH4)
✅ #carbon #monoxide (#CO)
✅ #sulfur #dioxide (#SO2)
(with just one transit)
#sodium #na #potassium #k #water #h2o #hydrogen #sulfide #h2s #carbon #dioxide #co2 #methane #ch4 #monoxide #co #sulfur #so2 #astronomy #exoplanet #jwst
O=C=O · @tuxom
1842 followers · 8902 posts · Server mastodon.socialEruption of #Tonga volcano likely not large enough to impact global #climate
At the height above the #JetStream in a layer known as the #stratosphere, #aerosols can remain for years. Importantly, when #SO2 reaches the stratosphere, it reacts with water and creates a hazy layer of gas that prevents sunlight from reaching the Earth's surface and can lead to cooler temperatures.
The SO2 mass from the eruption was 400 million kg which is to less for cooling.
https://edition.cnn.com/2022/01/17/world/volcano-eruption-tonga-global-climate-impact/index.html
#jetstream #climate #stratosphere #aerosols #so2 #tonga
