
Denise Gutzmer · @DeniseGutzmer
404 followers · 983 posts · Server mindly.social
The calculated soil moisture ranking percentile is lowest along the northern and southern borders of the continental U.S.
#SoilMoisture #drought

Hippy Steve · @exador23
297 followers · 3397 posts · Server m.ai6yr.org
That's a delightful sight for Mid August - at least for #SoCal
#socal #satellite #soilmoisture #FireWx
Denise Gutzmer · @DeniseGutzmer
383 followers · 901 posts · Server mindly.social
The calculated soil moisture ranking percentile shows driest soil in #Texas, in the Pacific Northwest, #Montana, North Dakota and #Missouri.
The calculated soil moisture anomaly map shows the largest deficits west of the upper Mississippi River in Missouri and Iowa.
#drought #SoilMoisture
#texas #montana #Missouri #drought #soilmoisture
Denise Gutzmer · @DeniseGutzmer
352 followers · 834 posts · Server mindly.social
Both the calculated soil moisture ranking percentile and the calculated #soilmoisture anomaly indicate exceedingly dry conditions in eastern #Nebraska and northern #Missouri.
#drought
https://www.cpc.ncep.noaa.gov/products/Soilmst_Monitoring/index.shtml
#soilmoisture #Nebraska #Missouri #drought

Denise Gutzmer · @DeniseGutzmer
298 followers · 708 posts · Server mindly.social
The Topsoil Percent Short to Very Short shows driest conditions in the Central and Southern Plains and increasing dryness in parts of the Eastern US.
The Subsoil Percent S/VS map shows conditions drying most along parts of the East Coast.
https://agindrought.unl.edu/Other.aspx
#soilmoisture #drought

· @gizz
3 followers · 5 posts · Server mstdn.social🎉 "Ramsauer & Marzahn present a global, hourly #SoilMoisture estimation based on #NASA's #GPM IMERG data and using a site-specific adjusted antecedent precipitation index (#API)"
🌧️🌍
🔗 https://doi.org/10.1080/01431161.2022.2162351
get the pdf here: https://www.tandfonline.com/eprint/6VHQ7JCCJXSPAMG3PVIG/full?target=10.1080/01431161.2022.2162351
Info:
https://www.researchgate.net/publication/368587895_Global_Soil_Moisture_Estimation_based_on_GPM_IMERG_Data_using_a_Site_Specific_Adjusted_Antecedent_Precipitation_Index
#soil #soils #moisture #global #data #DataSet #gpm #NASA #science #soilgrids #mdpi #remotesensing #satellit #ijrs #LMUMünchen #geography #Geodaten #geodata
#geodata #Geodaten #geography #lmumunchen #ijrs #satellit #remotesensing #mdpi #soilgrids #Science #DataSet #Data #global #moisture #soils #soil #api #gpm #NASA #soilmoisture

Lobelia Earth · @lobeliaearth
34 followers · 30 posts · Server mastodon.world
The European Geosciences Union General Assembly (#EGU23) started yesterday in Vienna!
With IsardSAT, eight of our young scientists will be presenting their work on #drought, #SoilMoisture and #CarbonStocks, using remote sensing data.
Stay tuned for more info on their work 👩💼
#EGU23 #drought #soilmoisture #carbonstocks
Denise Gutzmer · @DeniseGutzmer
296 followers · 699 posts · Server mindly.social
The calculated soil moisture anomaly and calculated soil moisture ranking percentile maps show how parched the Central and Southern Plains continue to be, as well as Florida and eastern Virginia, Maryland and Delaware.
#drought #soilmoisture
Denise Gutzmer · @DeniseGutzmer
286 followers · 660 posts · Server mindly.social
The calculated soil moisture anomaly (mm) and calculated soil moisture ranking percentile show parched conditions in the Central and Southern Plains, along the East Coast, Southeast and in the Pacific Northwest.
#drought #SoilMoisture
https://www.cpc.ncep.noaa.gov/products/Soilmst_Monitoring/US/Soilmst/Soilmst.shtml

· @gizz
1 followers · 1 posts · Server mstdn.social🎉 "Ramsauer & Marzahn present a global, hourly #SoilMoisture estimation based on #NASA's #GPM IMERG data and using a site-specific adjusted antecedent precipitation index (#API)"
🌧️🌍
🔗 https://doi.org/10.1080/01431161.2022.2162351
https://www.researchgate.net/publication/368587895_Global_Soil_Moisture_Estimation_based_on_GPM_IMERG_Data_using_a_Site_Specific_Adjusted_Antecedent_Precipitation_Index
Lobelia Earth · @lobeliaearth
32 followers · 21 posts · Server mastodon.worldSEEDS available data includes emissions and depositions of key #pollutants, #SoilMoisture, leaf area index
Data can be visualised directly on the platform or downloaded for further use
Visualisation can be over time or space (selected point or area) - here: depositions of NH3
Lobelia Earth · @lobeliaearth
33 followers · 17 posts · Server mastodon.worldSEEDS available data includes emissions and depositions of key #pollutants, #SoilMoisture, leaf area index
Data can be visualised directly on the platform or downloaded for further use
Visualisation can be over time or space (selected point or area) - here: depositions of NH3
Denise Gutzmer · @DeniseGutzmer
275 followers · 630 posts · Server mindly.social
The calculated soil moisture ranking percentile is extremely low in the Central and Southern Plains, the Southeast and in pockets of the Northwest. In contrast, California, the Southwest and parts of the eastern US are at their wettest.
#SoilMoisture #drought
Denise Gutzmer · @DeniseGutzmer
269 followers · 600 posts · Server mindly.social
The Ensemble-mean soil moisture percentile map shows values in the very low percentiles in the Central Plains, the Northwest and the Southeast. Extremely high #SoilMoisture also exists in parts of the West that have received abundant moisture.
https://www.cpc.ncep.noaa.gov/products/Drought/Monitoring/smp.shtml#
· @ely
135 followers · 418 posts · Server mastodon.greenAll you'd like to know about correctly assess the moisture in your soil.
#soilmoisture #soilmoisturesensor #irrigation #metergroup
Denise Gutzmer · @DeniseGutzmer
268 followers · 577 posts · Server mindly.social
The calculated soil moisture anomaly indicates driest soil in parts of the Central and Southern Plains, the Midwest and the Southeast.
The calculated soil moisture ranking percentile reveals soil in the driest percentile in the #Texas and #Oklahoma panhandles and #Oregon.
#Kansas #drought #soilmoisture
#texas #Oklahoma #oregon #kansas #drought #soilmoisture
Denise Gutzmer · @DeniseGutzmer
265 followers · 550 posts · Server mindly.social
The calculated soil moisture ranking percentile shows soil in the 1% ranking in the Central and Southern Plains and in the Northwest.
The calculated soil moisture anomaly (mm) indicates the largest anomalies in the Central and Southern Plains and also in the Midwest.
#SoilMoisture #USA
David Salesa · @DavidSD
129 followers · 325 posts · Server mstdn.social
There is a long-term trend towards an increasing time for #Ecosystems to recover (in terms of GPP) after #Droughts. Post-drought temperature and precipitation are key factors (https://www.nature.com/articles/nature23021), but recently soil moisture has been found to play a more important role (https://onlinelibrary.wiley.com/doi/full/10.1111/gcb.16620).
Under any of the future SSP scenarios, more than 60% of ecosystems could experience reductions in #SoilMoisture content, which may result in slower recovery from increasingly intense events.
#soilmoisture #droughts #ecosystems
· @ely
132 followers · 391 posts · Server mastodon.green
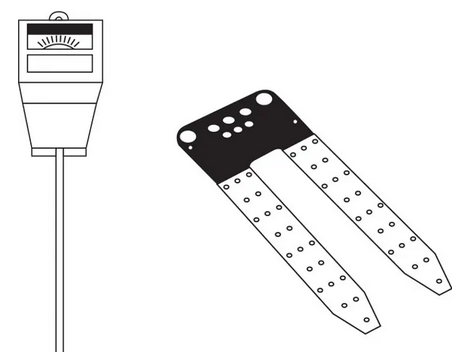
Do you use a water sensor for soil?
Are you playing with these sensors?
Get yourself educated!
#TDR, #FDR, #capacitance, #resistance: A comparison of common soil moisture sensing methods, their pros and cons, and their applications.
https://www.metergroup.com/en/meter-environment/measurement-insights/tdr-fdr-capacitance-compared
#soil #soilmoisture #soilmoisturesensor
#sensor #watersensor #moisturesensor
#lorawan #arduino #hobbyfarm
#metergroup
#TDR #fdr #capacitance #resistance #soil #soilmoisture #soilmoisturesensor #sensor #watersensor #moisturesensor #lorawan #arduino #hobbyfarm #metergroup