
thatvirtualboy · @thatvirtualboy
102 followers · 511 posts · Server techhub.socialIf you're the type who lives on the edge by running #iOS17 Beta, hit me up if you're interested in testing @hellothere Beta!
New features include #TipKit, Animated #SFSymbols, New Widgets, Pie #SwiftCharts, and lots more
#ios17 #tipkit #sfsymbols #swiftcharts

Stan Lemon · @stanlemon
7 followers · 49 posts · Server iosdev.spaceSwift charts sure doesn't like the thread sanitizer! I turned it off and the performance improvement inside of the simulator was a bit unbelievable. The good news is my sucky code isn’t as unperformant as I thought! #ios #iosdev #swiftui #swiftcharts #xcode
#iOS #iosdev #swiftui #swiftcharts #xcode

jaywardell · @jaywardell
26 followers · 83 posts · Server fosstodon.org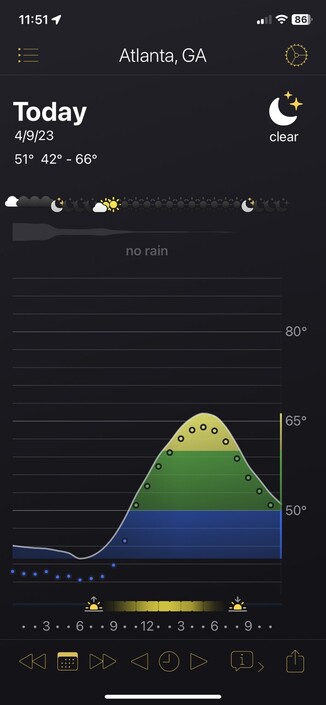
I spent the last two months wondering how to show UV Index cleanly and succinctly in #alldayweather, then yesterday I sat down to write it and within 48 hours I had a design I was happy with.
idk if there’s a lesson here, but I’m just proud of what I came up with.
#alldayweather #iosdev #macdev #swiftui #swiftcharts
jaywardell · @jaywardell
26 followers · 79 posts · Server fosstodon.org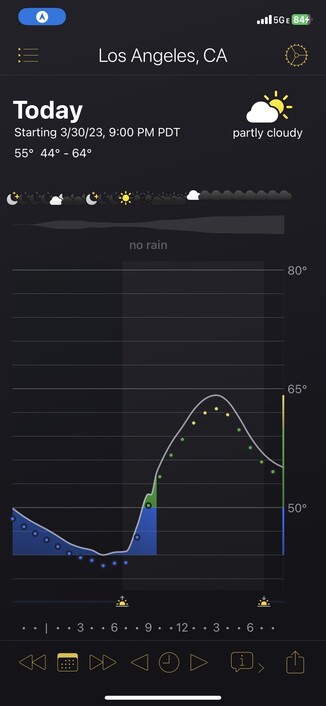
Yesterday was a huge day for #alldayweather. The iOS version was approved by the #appstore. So now there’s a #macos and an #ios version.
So if you’ve ever wanted a graph of the whole day’s weather on your phone, you can check it out.
#alldayweather #appstore #macos #ios #iosdev #macdev #swiftui #swiftcharts

CaliCoding · @calicoding
27 followers · 114 posts · Server mastodon.socialOk I really do love #SwiftCharts. It’s gotta be one of the best frameworks to come out of Apple in a long time. Really well crafted. There’s a steep learning curve, and has poor discoverability. But it’s highly composable, and once you get up to speed you create charts so quickly.
CaliCoding · @calicoding
25 followers · 94 posts · Server mastodon.socialI really love #SwiftCharts but sometimes it’s hard to know how to do basic customization. For example, how do you limit the range of the y axis to a reasonable range around the data, so zero is *not* the lower bound?

thatvirtualboy · @thatvirtualboy
36 followers · 107 posts · Server techhub.socialToday’s update also includes 2 all-new charts using #SwiftCharts. Sender Stats shows you how many cards you’ve received from your senders since you started tracking them with Hello There. Post stats shows how many hand-written cards you’ve sent with Hello There, and what kind. https://techhub.social/@thatvirtualboy/109847257655469301

Sören · @chucker
399 followers · 7634 posts · Server norden.socialBriefly got excited about #SwiftCharts (you know, the one that doesn’t have pie charts) but it requires macOS 13 so nah. I appreciate all the work they put into making them look good, be accessible, etc. out of the box, but I can’t raise system requirements for such a niche thing.
I appreciate Apple wants to incentivize upgrades, but I wish they put more stuff in SwiftPM.

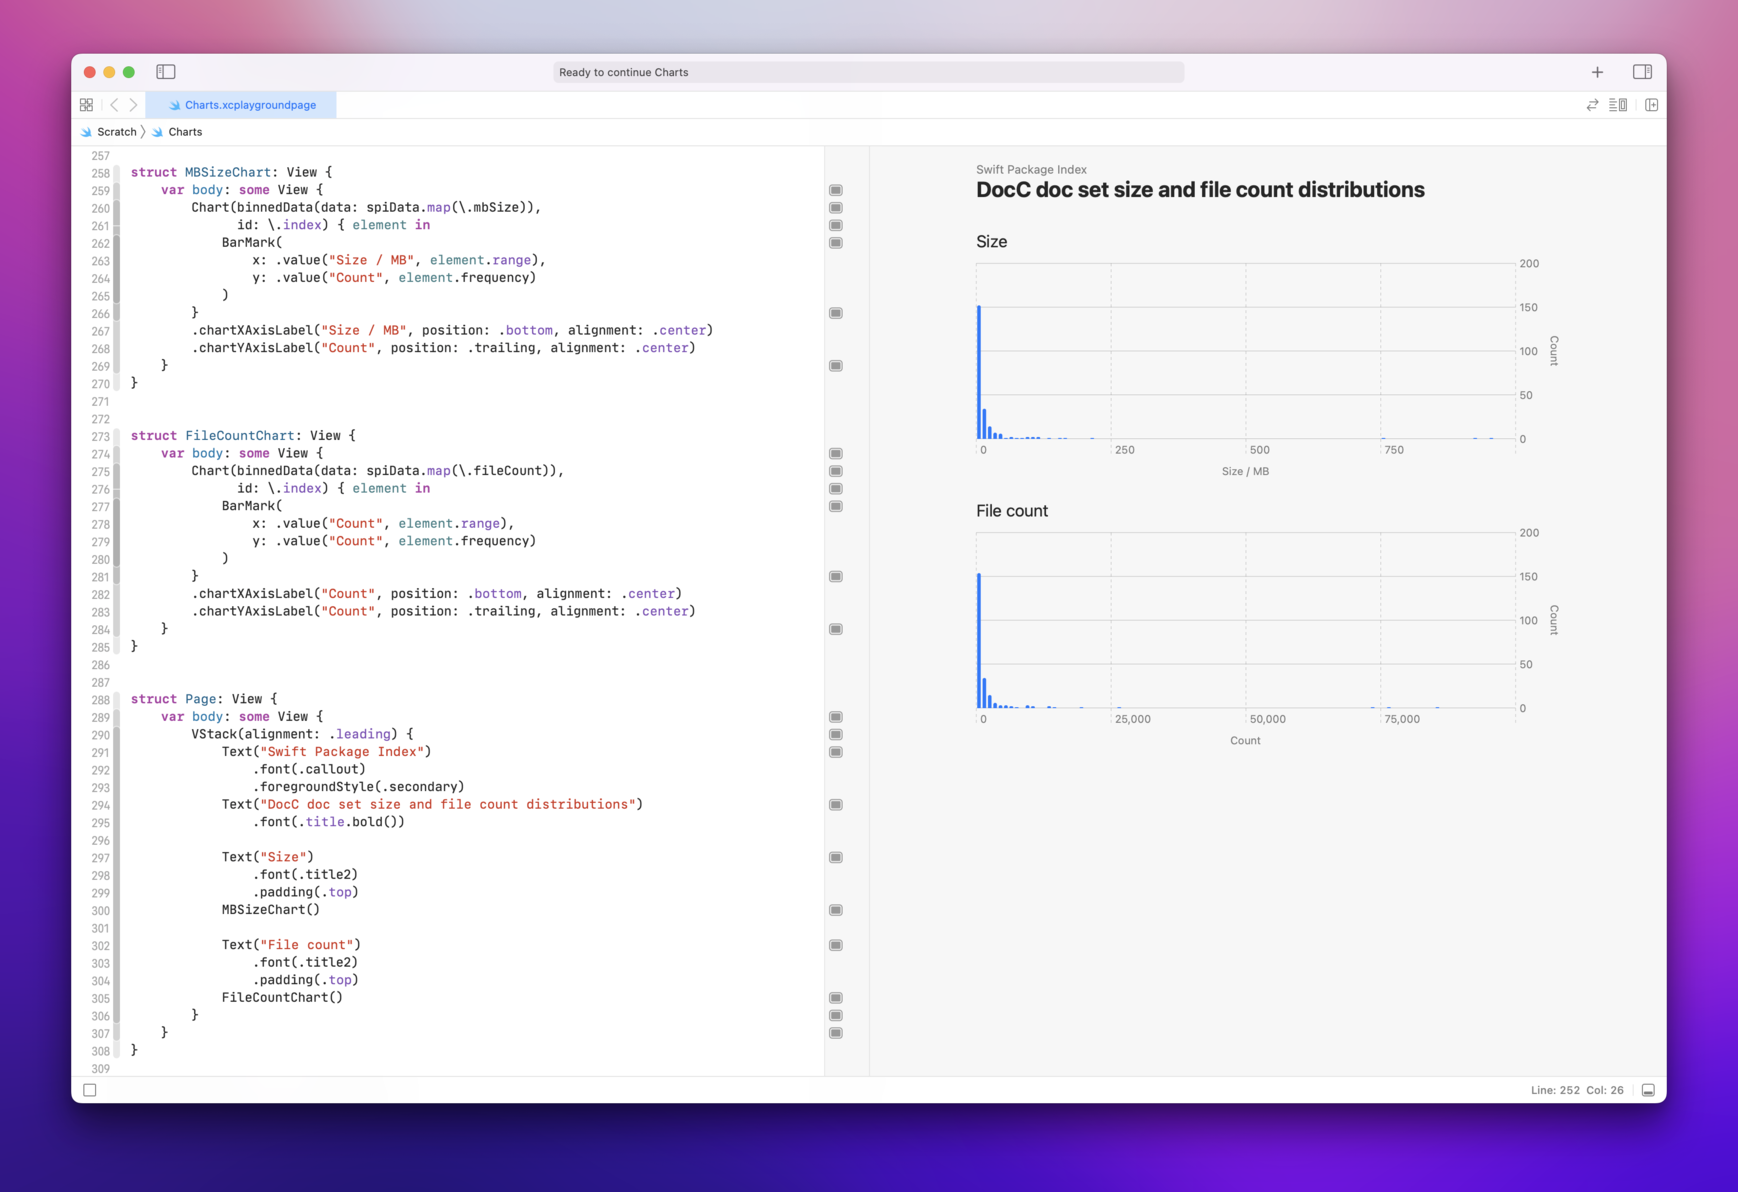
Sven A. Schmidt · @finestructure
557 followers · 2262 posts · Server mastodon.social
Since people asked, I’ve posted the self-contained example as a gist on Github and added a button to export the page as a PDF. Works wonderfully, even from within a simple playground 🎉
NB: the PDF is not rasterised - you can select the text and zoom in without any loss of fidelity.
#Swift #SwiftLang #SwiftUI #SwiftCharts
https://gist.github.com/finestructure/45881a35819b5ebf850c437c54f43b8c
#swift #swiftlang #swiftui #swiftcharts
Sven A. Schmidt · @finestructure
547 followers · 2246 posts · Server mastodon.social
I had a hunch that I could take on tasks that I used to do with Python + matplotlib + Jupyter with Swift Charts + SwiftUI + Playgrounds instead. But I had no idea it’d be this nice and easy. Plus I find the default result better looking and I have much more control over everything around the chart, like labels, titles etc.
This will change everything for me when working with charts.
#swift #swiftlang #swiftui #swiftcharts #swiftplaygrounds
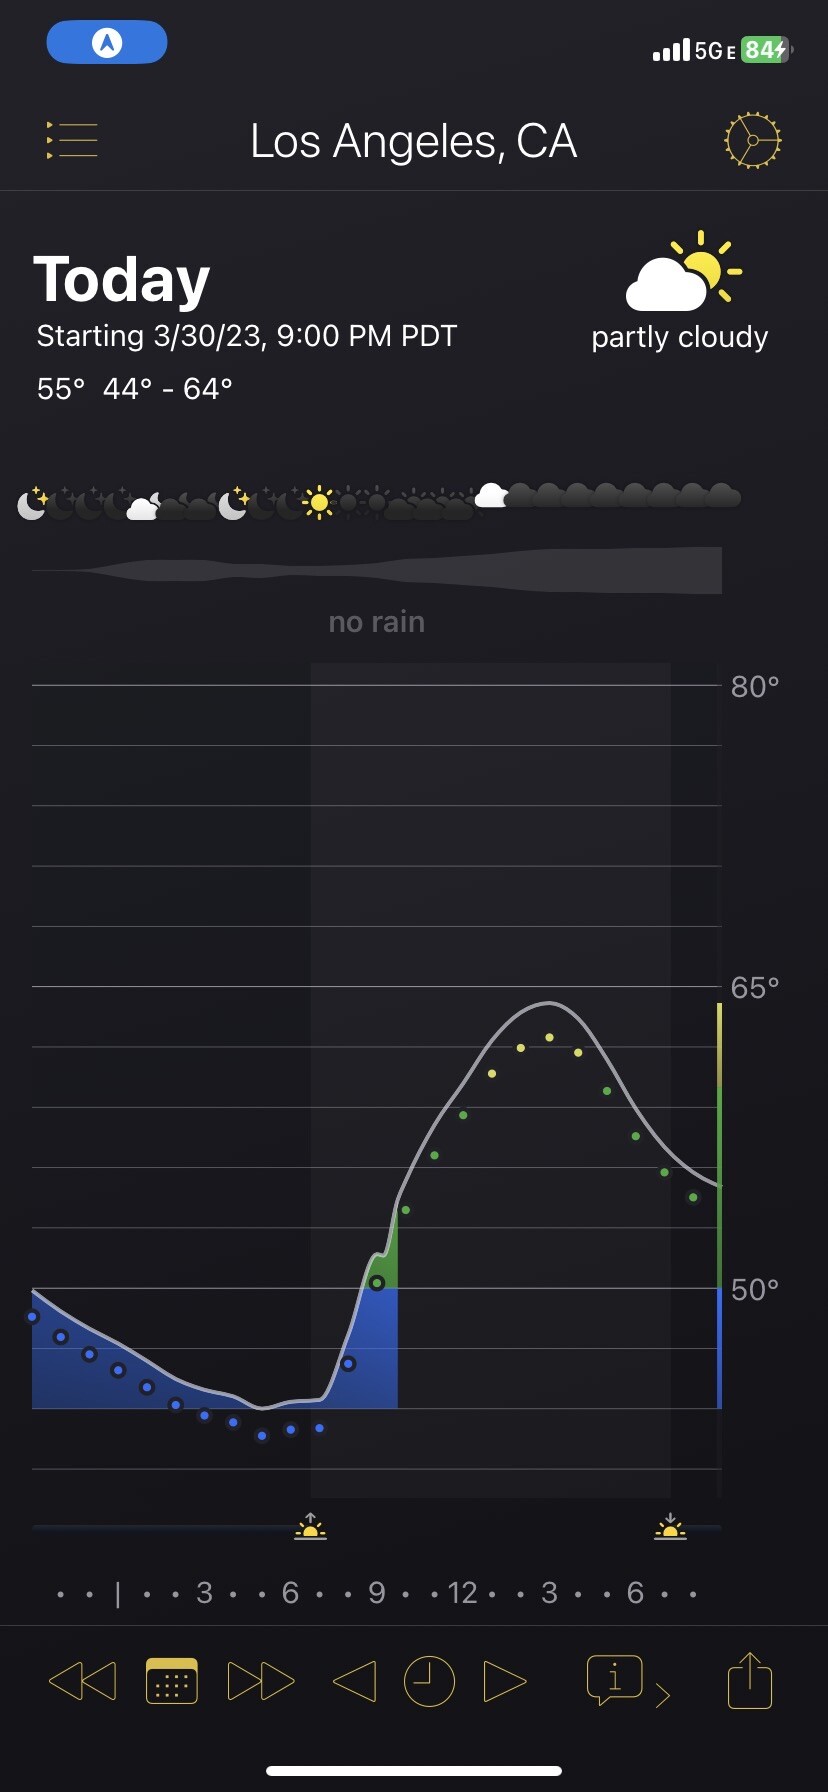
jaywardell · @jaywardell
11 followers · 15 posts · Server fosstodon.org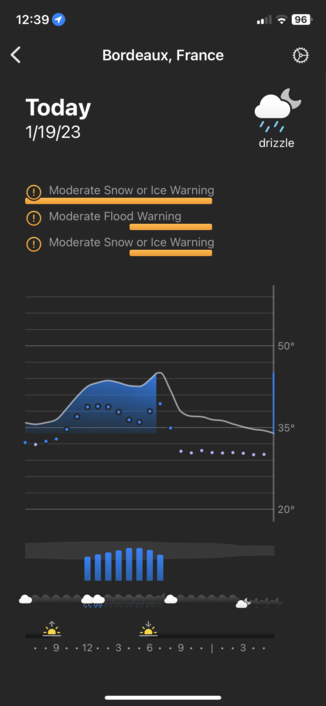
More fun with #SwiftCharts #swiftui #weatherkit Ive always wanted to see how long an alert was going to stay in effect visually.
#swiftcharts #swiftui #WeatherKit
jaywardell · @jaywardell
10 followers · 12 posts · Server fosstodon.org
#swift #swiftui
I’ve been quiet on here lately. I started playing around with #SwiftCharts and #WeatherKit. Here’s how it’s looking.
#swift #swiftui #swiftcharts #WeatherKit
jaywardell · @jaywardell
10 followers · 12 posts · Server fosstodon.org
Ive been quiet on here lately. I started toying around with #WeatherKit and #SwiftCharts and this is where I’m at. Would love any feedback.
jaywardell · @jaywardell
7 followers · 8 posts · Server fosstodon.org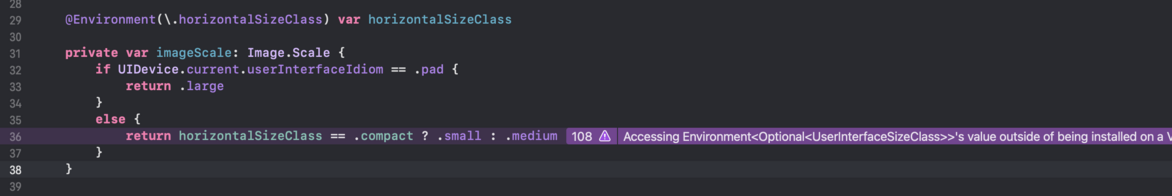
A Challenge:
I was going to ask for help, but I just figured it out.
The below runtime error was happening when the imageScale property was accessed from within an annotation on a PointMark inside a custom ChartContent. It happened when the view first appeared and also after a trait collection switch (portrait to landscape, for example).
When the view appeared on screen, the images were always in the medium imageScale.
What was I doing wrong?

Brendan@Tapforms · @tapforms
36 followers · 16 posts · Server mastodon.social#MacDev #iosDev is there a report generation framework similar to something like #SwiftCharts that can generate nice looking, configurable tabular reports that I can embed in my Mac and iOS apps?
Many moons ago I used to program using PowerBuilder and the report generation built-in was great.