
Eli Pousson · @elipousson
269 followers · 317 posts · Server dads.coolI wrote a rough vignette for my {getACS} R package comparing my crosswalk functions to the interpolation function in #tidycensus https://elipousson.github.io/getACS/articles/area-xwalk.html
#RStats
Eli Pousson · @elipousson
263 followers · 305 posts · Server dads.coolI also spent some time this afternoon incorporating the option to calculate weighted means instead of weighted sums into use_area_xwalk: https://elipousson.github.io/getACS/reference/make_area_xwalk.html
This is basically essential for aggregating median values (which I discovered after creating some bad data that I now need to correct).
That feature is based directly on the tidycensus interpolate_pw function https://walker-data.com/tidycensus/reference/interpolate_pw.html
#RStats #tidycensus
Eli Pousson · @elipousson
263 followers · 305 posts · Server dads.coolStayed up late last night and added a handy function for collapsing ACS variables into groups https://elipousson.github.io/getACS/reference/collapse_acs_variables.html
Suggestions or feedback on the {getACS} package are welcome! I've been spending too much time on it the last couple weeks but I'm really excited about the potential.
#tidycensus #RStats

terence · @terence
1783 followers · 288 posts · Server fosstodon.org
Finally found some time to play with the #aerialod beta, so here's my first attempt—a map showing median household income by county across the conterminous USA. Does it need to be 3D? No. Is it more fun in 3D? Most assuredly yes. 😋
#aerialod #dataviz #rstats #tidycensus
Eli Pousson · @elipousson
256 followers · 292 posts · Server dads.coolCompletely missed the addition of a dedicated function for population-weighted interpolation to the #tidycensus package back in September https://walker-data.com/tidycensus/reference/interpolate_pw.html
Eli Pousson · @elipousson
256 followers · 292 posts · Server dads.coolWorking on a new package {getACS} with a lot of potential (IMHO) to make it even easier to work with data from #tidycensus
https://elipousson.github.io/getACS/
Per usual, I'm procrastinating on prepping for my fall course + a presentation next week by falling down a R package development rabbit hole. Let me know what you think if you try it! #RStats

Chuck Purvis · @charleypurvis
66 followers · 182 posts · Server sfba.social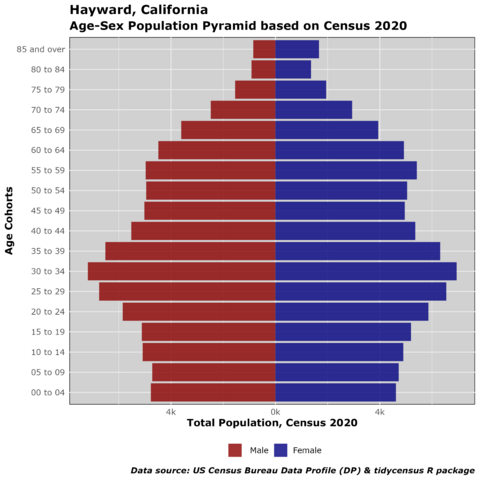
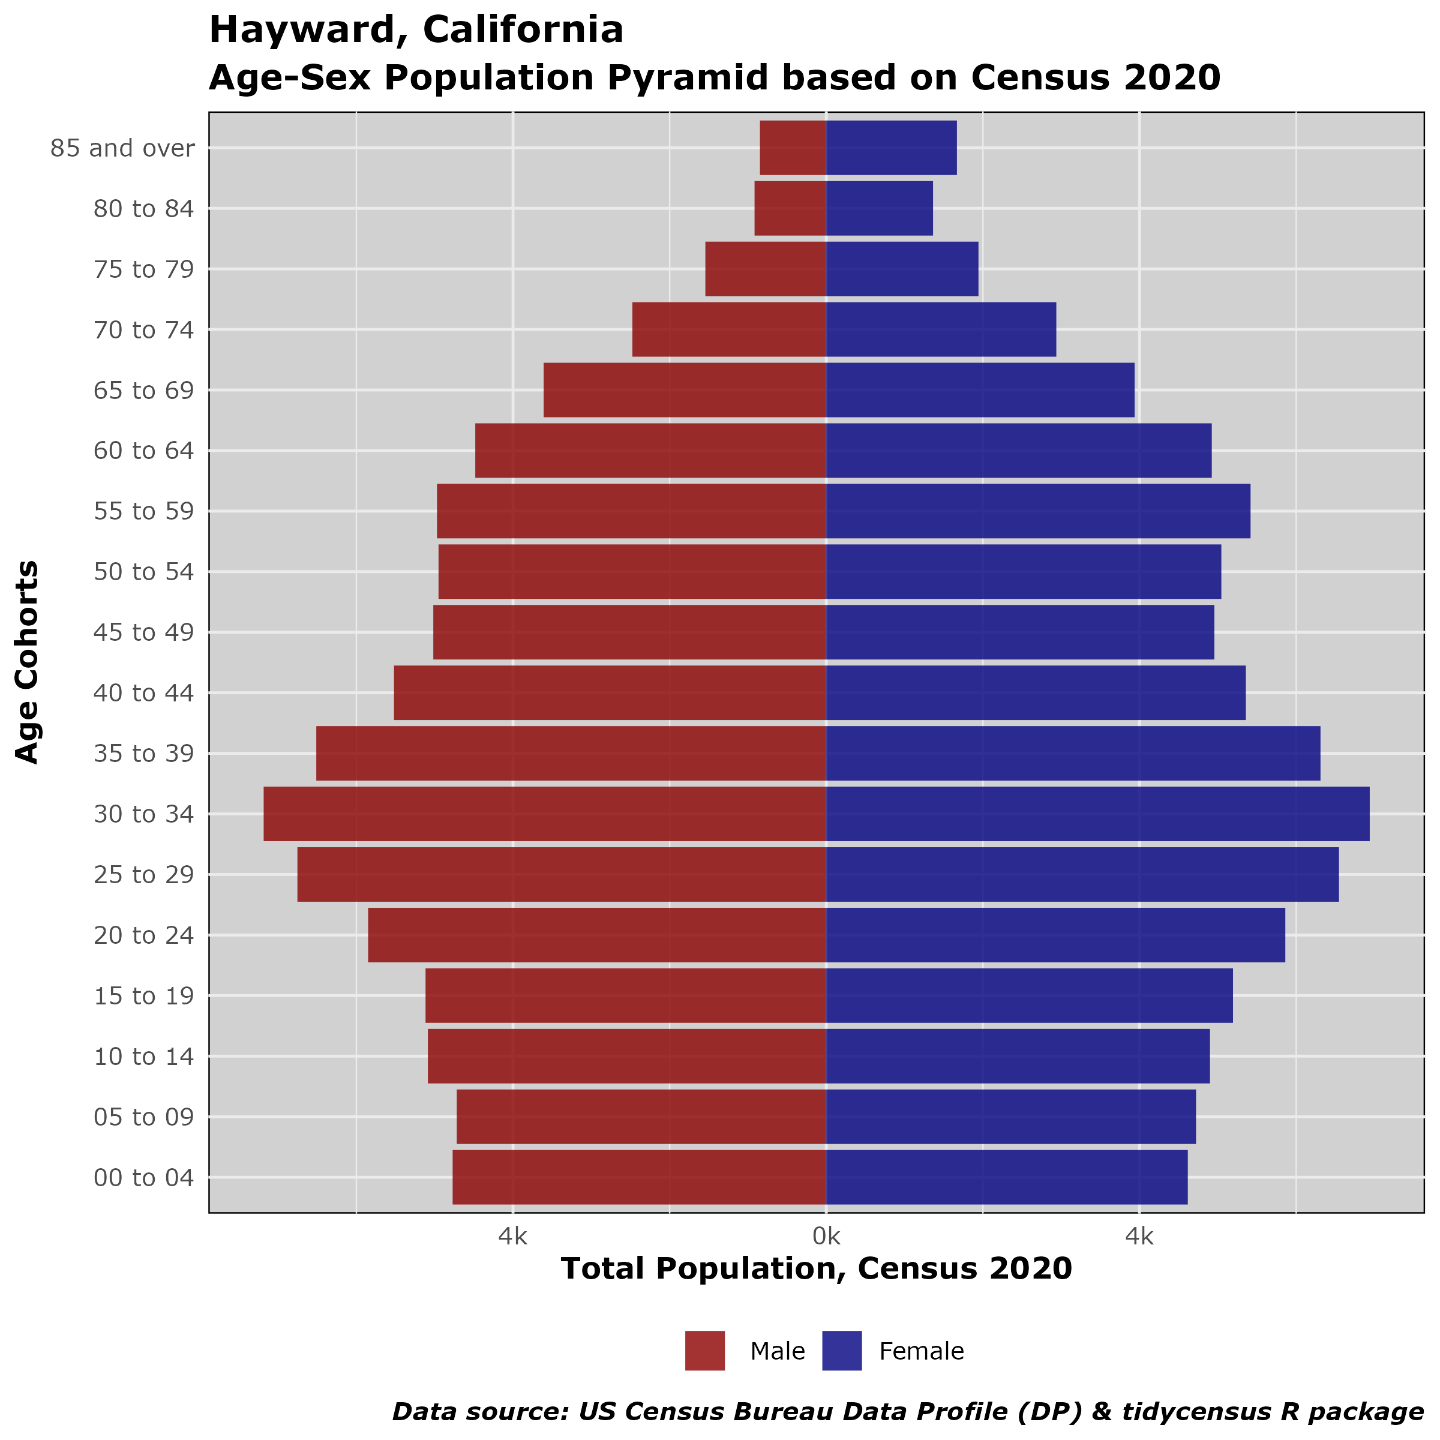
Easy to create age-sex population pyramids using #census2020 demographic profile data released May 2023; and the #rstats programs #tidycensus #tidyverse and #ggplot2
Adapted from the Kyle Walker book “Analyzing US Census Data”
scripts are shared:
https://github.com/chuckpurvis/r_scripts
#Census2020 #rstats #tidycensus #tidyverse #ggplot2 #census
Chuck Purvis · @charleypurvis
66 followers · 182 posts · Server sfba.social
@smach mastodon is so dependent on folks hashtagging the heck out of everything, like #rstats and #tidyverse and #tidycensus and #census … I definitely follow Kyle on twitter. #tidycensus is a lifesaver when trying to obtain #census #data
But I’ve learned a lot about non-US #censuses on mastodon!
#rstats #tidyverse #tidycensus #census #data #censuses

Christian Testa · @ctesta
381 followers · 143 posts · Server fediscience.org
I'm super excited that later today at 10:30 Eastern Time I'll be speaking at the Data+Donuts series at Harvard Kennedy School about the Public Health Disparities Geocoding Project 2.0.
Among other things, I'll talk a little bit about the role the #tidycensus package and GIS software in R like #sf can serve in analyzing data to advance health justice.
Find the online registration here:
@rstats #HealthJustice #GIS #HealthEquity #Epidemiology #PublicHealth #rstats
#rstats #publichealth #epidemiology #healthequity #gis #healthjustice #sf #tidycensus
Christian Testa · @ctesta
381 followers · 143 posts · Server fediscience.orgI'm super excited that later today at 10:30 Eastern Time I'll be speaking at the Data+Donuts series at Harvard Kennedy School about the Public Health Disparities Geocoding Project 2.0.
Among other things, I'll talk a little bit about the role the #tidycensus package and GIS software in R like #sf can serve in analyzing data to advance health justice.
Find the online registration here:
@rstats #HealthJustice #GIS #HealthEquity #Epidemiology #PublicHealth
#publichealth #epidemiology #healthequity #gis #healthjustice #sf #tidycensus

Sharon Machlis · @smach
2068 followers · 1076 posts · Server fosstodon.org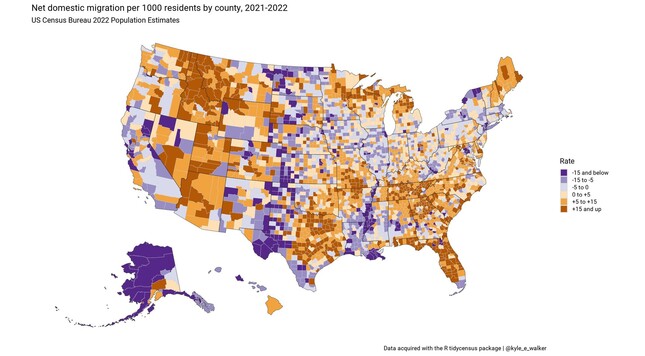
“The 2022 US Census Population Estimates were released last week, giving us county-level information on population change.
These datasets aren't on the Census API, but you can now access them in #rstats through #tidycensus (dev version)” - Kyle Walker on Twitter
https://github.com/walkerke/tidycensus
#RSpatial #ddj
#rstats #tidycensus #rspatial #ddj

Harald Kliems · @haraldkliems
279 followers · 954 posts · Server fosstodon.org
Today's Wisconsin State Journal ran a piece on population change in #Wisconsin based on the Census Bureau's population estimates. I quickly fired up #TidyCensus and #tmap to make my own maps of the data. Code: https://gist.github.com/vgXhc/19f64b5af6e4aba55e747d0b54ca0229 #rstats #rspatial
#wisconsin #tidycensus #tmap #rstats #rspatial
Harald Kliems · @haraldkliems
279 followers · 952 posts · Server fosstodon.org
I read a news article about the latest population estimates for 2020-2022 today and was wondering, "can I get that data from #tidycensus yet?" The answer is, unsurprisingly, of course!

Adrienne 📊 · @adrienne
446 followers · 567 posts · Server fosstodon.orgQ: Does anyone have topoJSON files for the 117th congress.. before I go make them myself using #tidycensus and mapshaper? #ObservableJS #JS #javascript #d3
#tidycensus #ObservableJS #js #javascript #d3

Andrew Heiss :rstats: · @andrew
3555 followers · 1068 posts · Server fediscience.org
And here's the finished version, along with #rstats code to grab all the data from the Census with #tidycensus https://stats.andrewheiss.com/zany-zebra/notebook/acs-data.html #quartopub
#QuartoPub #tidycensus #rstats
Andrew Heiss :rstats: · @andrew
3553 followers · 1065 posts · Server fediscience.org
Working with ACS data is a complex mess because there are *so many* possible tables and variables, so I've been making a little notebook with #QuartoPub to keeep track of everything #rstats #tidycensus
#tidycensus #rstats #QuartoPub
Chuck Purvis · @charleypurvis
59 followers · 125 posts · Server sfba.social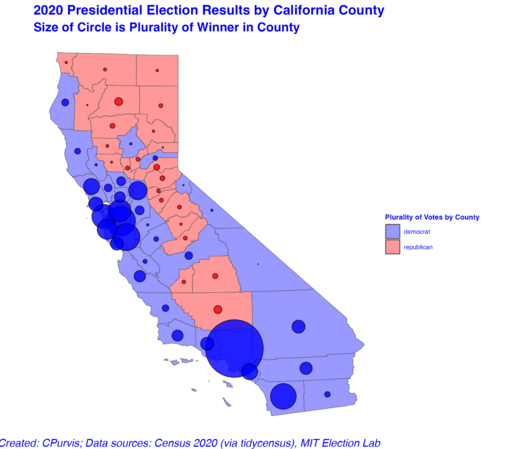
Today I learned a new #rstats package: #cartogram . This allows creation of Dorling cartograms (non-overlapping bubbles).
It's using the same 2020 presidential election county-level databased I created merging MIT Election Lab data with #tidycensus -derived files from the #census2020
The California Dorling plot is better by showing non-overlapping circles, especially in the Bay Area.
The Texas Dorling plot shows Harris County (Houston) nudged into the Gulf of Mexico. Dallas County and Travis County (Austin) have pushed (repelled) the little red bubbles to be more prominent.
All maps were created with the #tidyverse package #ggplot2
This is a lot of fun, for me, at least!
#rstats #cartogram #tidycensus #Census2020 #tidyverse #ggplot2
Chuck Purvis · @charleypurvis
59 followers · 124 posts · Server sfba.social
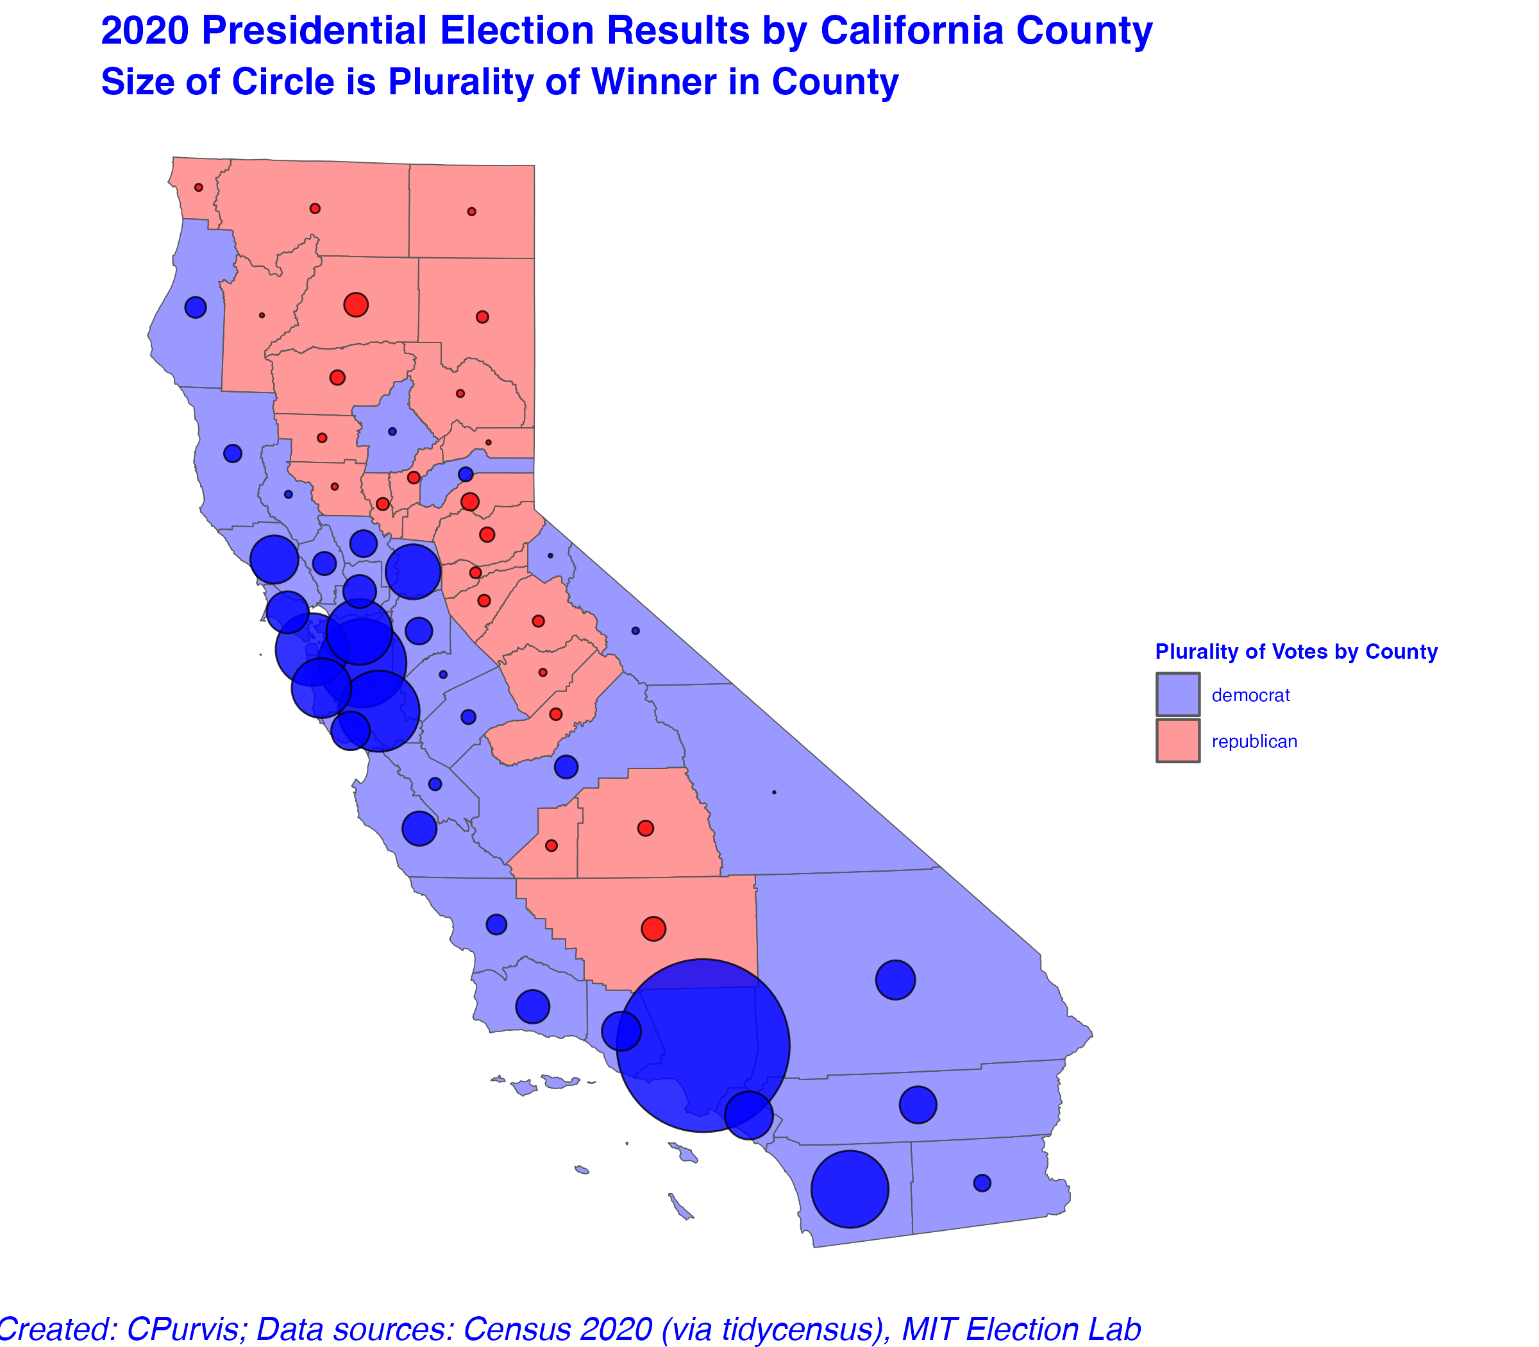
I've always been interested in political geography, starting in the late 1970s when I was a geography undergrad at #CSUN . This was pre-GIS. Everything was zipatone, x-acto knives and ink.
Now I'm retired/ I can mess around with maps and data, using #rstats #tidycensus #ggplot
These are my first attempts in mapping 2020 Presidential Election results, showing plurality (margin of victory) by county, by state.
These are graduated symbol (circle) maps, where the small bubbles are on top of the larger bubbles.
This was a good start.
#csun #rstats #tidycensus #ggplot
Chuck Purvis · @charleypurvis
53 followers · 79 posts · Server sfba.social@Cmastication In #SAS we have data steps and procedures steps. In #rstats there is no distinction. I was comfortable with proc freq, proc summary, proc univariate and proc sort. These days the #tidyverse package #dplyr can do all of that!
The hard part of #rstats is knowing there are multiple ways of accomplishing the same or similar tasks. My introduction to #rstats would’ve been smoother had I started with #dplyr
I started learning R to access #census data using #tidycensus
#sas #rstats #tidyverse #dplyr #census #tidycensus
Chuck Purvis · @charleypurvis
53 followers · 79 posts · Server sfba.social@kylewalker great to follow you on here as well as twitter!
I’ve recently been using the #rstats packages lehdr and tigris to analyze job density (workers at work per square mile) to complement population density analysis using #tidycensus and the #tidyverse
The lehdr package is new, as of February 2022, I believe.
#rstats #tidycensus #tidyverse #census #acs #lodes