· @NerdRunner
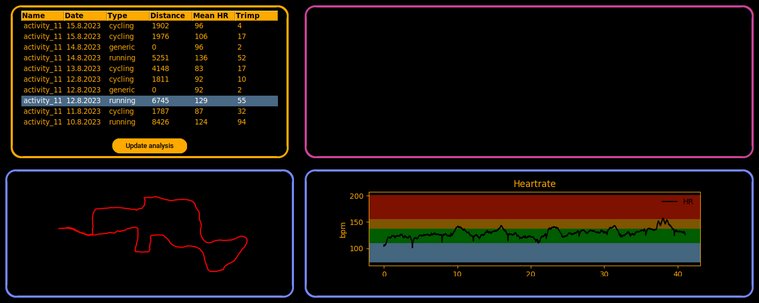
43 followers · 94 posts · Server social.tchncs.deFor the single run analysis: I removed the map view because it took to long to generate the map tiles. Now it's just a xy-Plot.
Also, I added some colors to the HR plot, which are showing the HR-Zones.
#tnrp #TheNerdRunnerProject #running #lcars #python #opensource
#tnrp #thenerdrunnerproject #running #lcars #python #opensource
· @NerdRunner
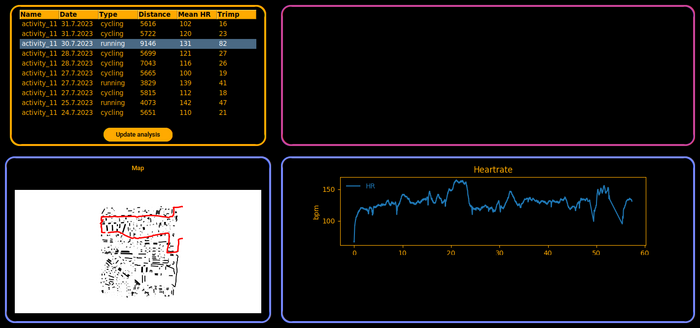
39 followers · 89 posts · Server social.tchncs.deAnalysis of a single activity is on it's way. Map is displayed (unfortunately very, very slow and with some bugs) and heart rate plotted.
#running #opensource #python #tnrp #TheNerdRunnerProject
#running #opensource #python #tnrp #thenerdrunnerproject
· @NerdRunner
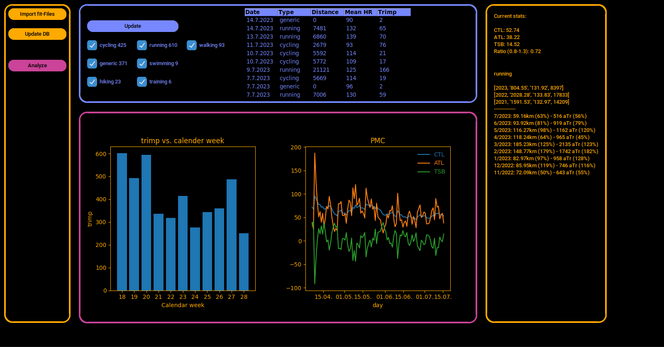
29 followers · 81 posts · Server social.tchncs.deThe main gui for general activity analysis is more less complete. Now let's concentrate on single acitvity analysis.
#opensource #running #lcars #python #training #fitfile #tnrp #TheNerdRunnerProject
#opensource #running #lcars #python #training #fitfile #tnrp #thenerdrunnerproject
· @NerdRunner
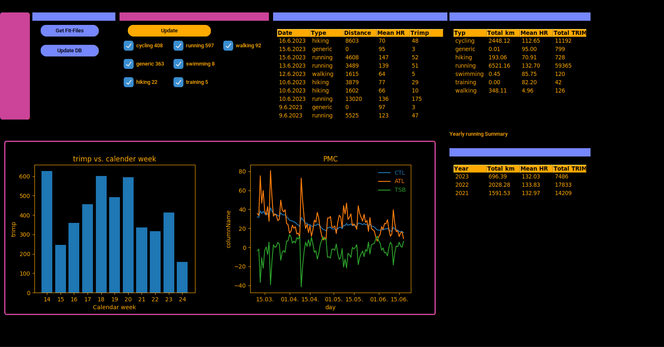
23 followers · 63 posts · Server social.tchncs.deLong ago I started working on my own tool to analyse .fit files (TheNerdRunnerProject). At that time I also watched season 3 of Picard ... this triggered me to build my gui based on the LCARS system.
Here my first guess, for sure not perfect and still a lot of work to do.
Has anyone implemented a gui in LCARS style in python?
#running #opensource #lcars #TheNerdRunnerProject #tnrp #python #startrek
#startrek #python #tnrp #thenerdrunnerproject #lcars #opensource #running
· @NerdRunner
19 followers · 52 posts · Server social.tchncs.deI've started rewriting my .fit file analysis tool to be opensource. This is more or less a library of Python files to analyze your fit files.
At the moment you can just import the files ... Analysis a graphical user interface and more is comming later.
If you want to join, you can pull under https://github.com/NerdRunner/TheNerdRunnerProject
Be careful. This is under heavy development and some things will change
#tnrp #TheNerdRunnerProject


