
Sally Jeffery · @sallyjeffery
73 followers · 625 posts · Server zirk.usMost of the time I'm really quite fond of Hackney Council. Their Parks and Green Spaces department have just answered a long-felt want of mine.
"This map displays data from the Council's tree management software and currently identifies in excess of 45,000 trees plotted across streets, parks, housing and open spaces. The map does not represent trees on private land, unless they are protected by a Tree Preservation Order (TPO)."

Elias Dabbas :verified: · @elias
47 followers · 61 posts · Server seocommunity.social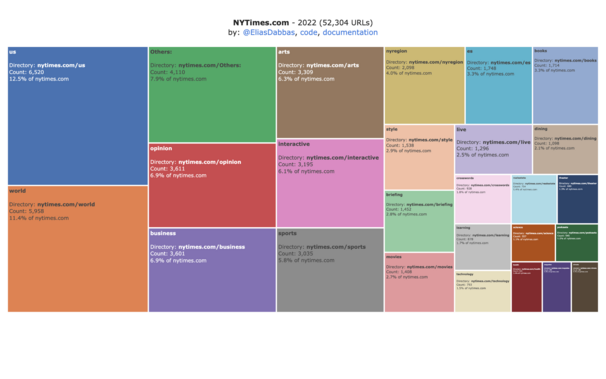
The split of topics that The New York Times covered in 2022.
Interactive HTML chart & code:
https://bit.ly/3zSxbNh
You can check other years and see how/if their publishing has changed.
I removed the dates from URLs in this case (YYYY/MM/DD) to get a better overview. Note that you can include links* in the chart:
Links*: more than one
Links*: using a URL shortener like bit[.]ly
Links*: containing UTM codes
#DataScience #DataVisualization #Python #treemap #advertools #adviz #SEO
#datascience #datavisualization #python #treemap #advertools #adviz #seo
Elias Dabbas :verified: · @elias
47 followers · 60 posts · Server seocommunity.social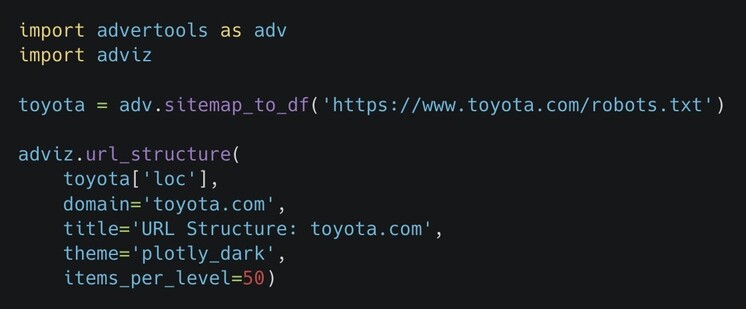
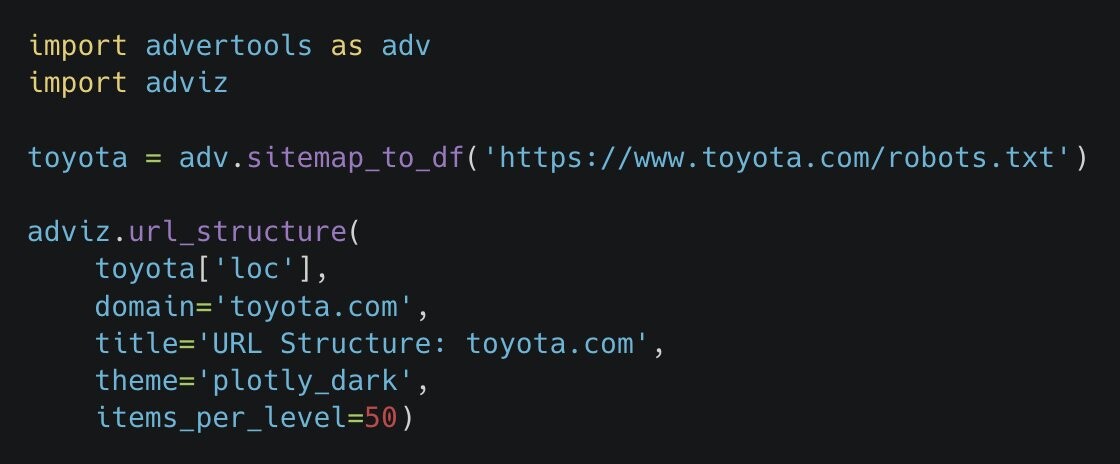
With 2 commands you can:
1. Convert an XML sitemap to a table
2. Visualize its URLs with a treemap
This is toyota[.]com
You can download the interactive file here:
#DataScience #DataVisualization #Python #treemap #advertools #DigitalMarketing #SEM #SEO
#datascience #datavisualization #python #treemap #advertools #DigitalMarketing #SEM #seo
Elias Dabbas :verified: · @elias
47 followers · 59 posts · Server seocommunity.social
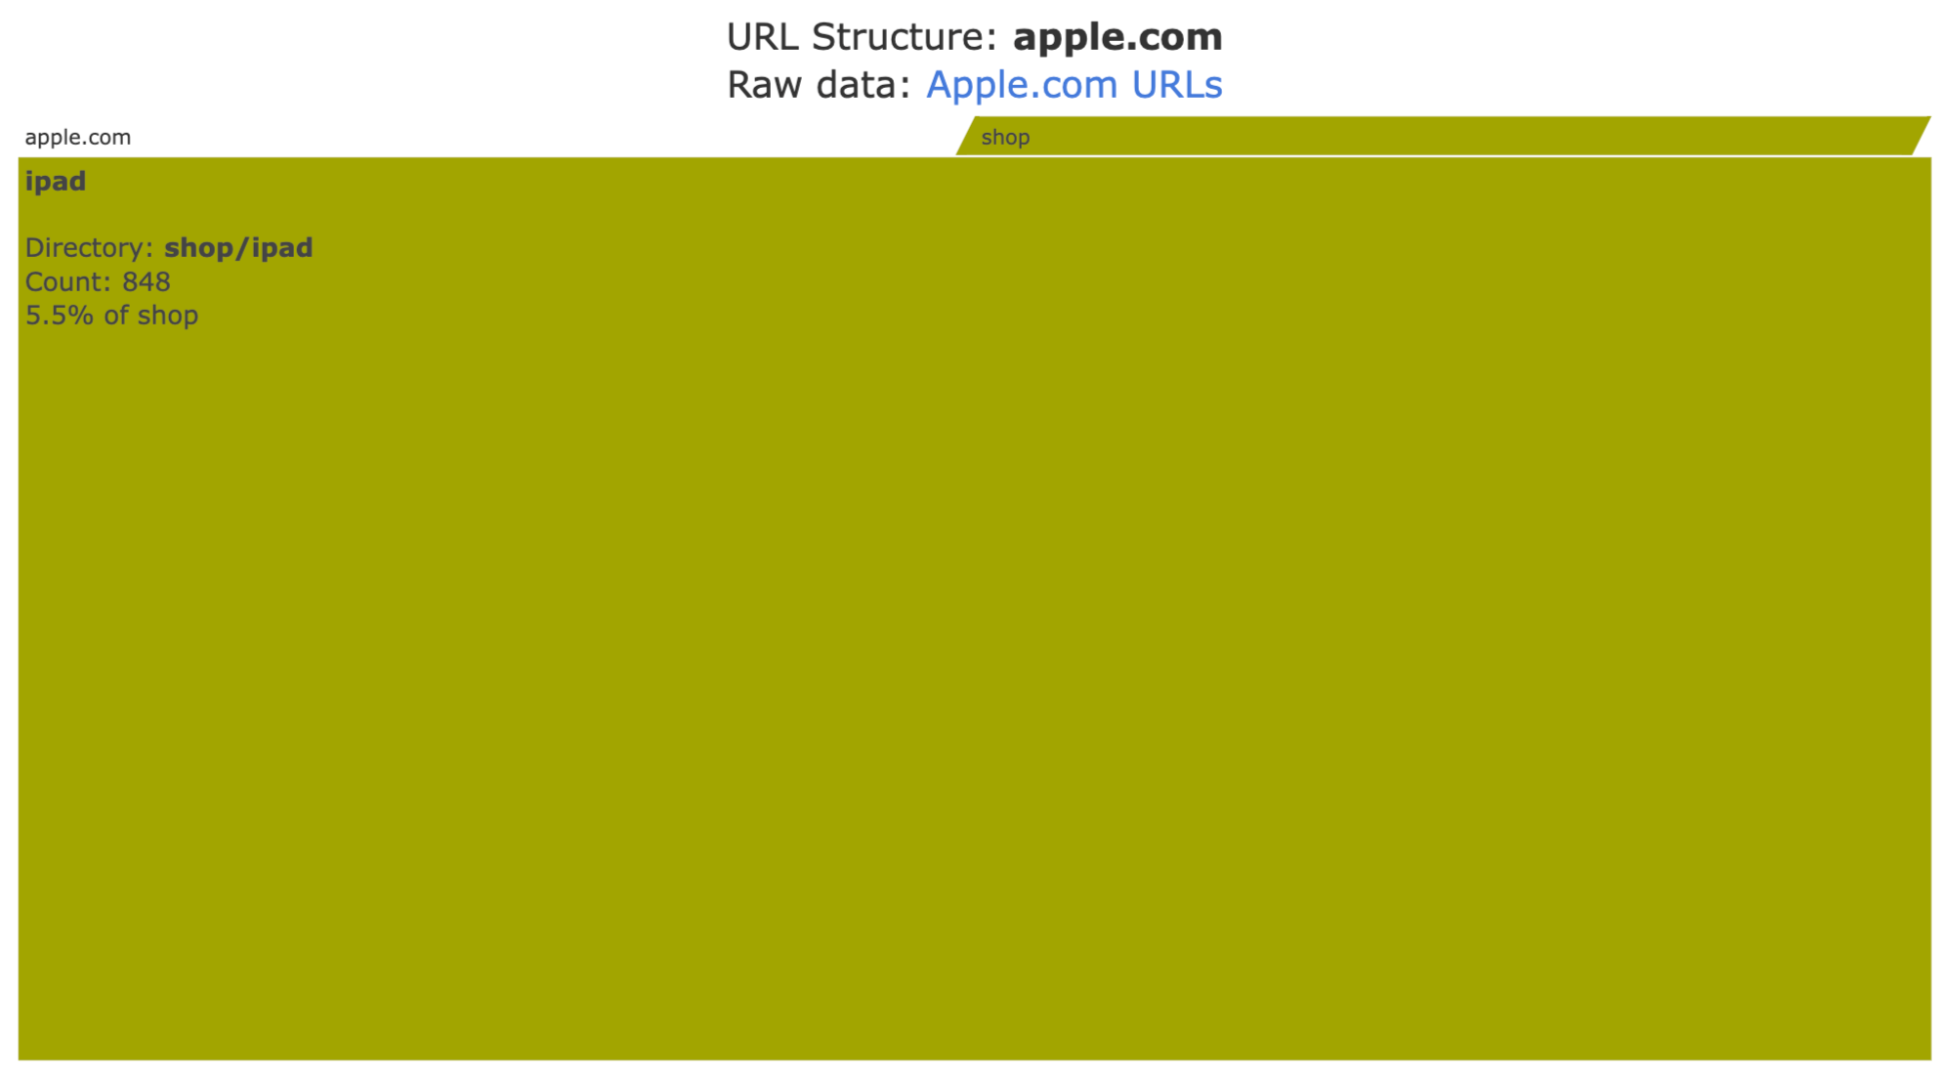
Code for visualizing a website's URL structure is ready for testing!
Many changes will be introduced later, but this is a good-enough version to try and play with.
Please let me know if you try and get any issues, or have suggestions.
#DataScience #DataVisualization #Python
#treemap #advertools #adviz #DigitalMarketing #SEM #SEO
#datascience #datavisualization #python #treemap #advertools #adviz #DigitalMarketing #SEM #seo

Asjad Naqvi :stata: · @asjadnaqvi
427 followers · 267 posts · Server econtwitter.net
Since I was already making these figures, might as well submit them for the #30DayChartChallenge Day6: #OWID.
CO2 emissions by regions and countries. Made in #Stata using the #treemap package (https://github.com/asjadnaqvi/stata-treemap). One of the hardest ones to code but it's pretty solid now.
#30DayChartChallenge #owid #Stata #treemap

Open Data Zurich · @OpenDataZurich
281 followers · 31 posts · Server swiss.socialDie statistischen Daten zur #Wohnbevölkerung der Stadt #Zürich stehen aktualisiert bis 2022 #Opendata zur Verfügung: https://data.stadt-zuerich.ch/dataset?q=bev%C3%B6lkerung&sort=score+desc%2C+date_last_modified+desc&tags=sasa
Hier z.B. die Wohnbevölkerung nach Nationalität und Stadtquartier https://data.stadt-zuerich.ch/dataset/bev_bestand_jahr_quartier_nationalitaet_od3361
#DataViz #Treemap #plotly
#wohnbevolkerung #zurich #opendata #dataviz #treemap #plotly
Asjad Naqvi :stata: · @asjadnaqvi
417 followers · 206 posts · Server econtwitter.net
Asjad Naqvi :stata: · @asjadnaqvi
399 followers · 119 posts · Server econtwitter.netA major update to the @Stata #treemap package is now out. v1.4 fixes has the following major changes:
- The layer order is now higher to lower tiers
- "percent" option renamed to "share"
- Children now respect the boundaries of the parents.
https://github.com/asjadnaqvi/stata-treemap
More 👇
Asjad Naqvi :stata: · @asjadnaqvi
331 followers · 80 posts · Server econtwitter.netBtw #treemap was 10x more complex to program than #sankey. It employs a divide-&-conquer algorithm that attempts to optimize box placement, either by slicing or dicing, for a given width, height, aspect ratio. This means that a change in dimensions = complete change in layout.
Asjad Naqvi :stata: · @asjadnaqvi
331 followers · 80 posts · Server econtwitter.net
Here are data tests using #COMTRADE. The #treemap shows the % share of petroleum exports by country and subregion.
#sankey shows subregion to subregion flows of petroleum products.
Both packages are part of the #heirarchical #dataviz series. More on this later.
#comtrade #treemap #sankey #heirarchical #dataviz
Asjad Naqvi :stata: · @asjadnaqvi
331 followers · 78 posts · Server econtwitter.net
Tony 📊 · @tonyvisualizes
263 followers · 743 posts · Server vis.social

Niklas Elmqvist · @elm
326 followers · 177 posts · Server vis.social
UMD iSchool Dean Keith Marzullo teeing up Ben Shneiderman on his reception for the treemap art project “Every Algorithm has Art in It” where treemaps are used for beautifully displaying data. #visualization #treemap

Florin · @florin
122 followers · 133 posts · Server vis.social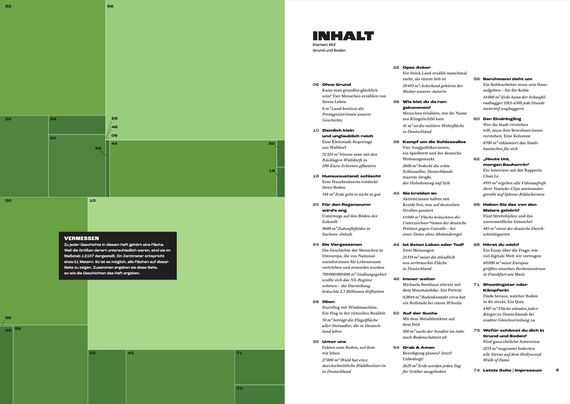
A slightly different use of a #treemap: For "Klartext", the magazine of the German School of Journalism with the topic "Land", the students assigned a specific size to each story. In the table of contents, we were thus able to show how these areas together make up a page, just as the stories make up the magazine.
#infographics #dataviz #treemap
Asjad Naqvi :stata: · @asjadnaqvi
265 followers · 24 posts · Server econtwitter.net
RT @asjadnaqvi
The @Stata #treemap package has been patched to:
- prevent accidental drops if there were duplicate values in the top most category
- sorting has been stabilized to get rid of random trees
- color grading within categories
Update here:
https://github.com/asjadnaqvi/stata-treemap
Asjad Naqvi :stata: · @asjadnaqvi
265 followers · 22 posts · Server econtwitter.net
The :stata: #treemap package has been patched to:
- prevent accidental drops if there were duplicate values in the top most category
- sorting has been stabilized to revent randomness in trees
- color grading within categories
Update from here:
https://github.com/asjadnaqvi/stata-treemap

Terence Eden · @Edent
4223 followers · 5412 posts · Server mastodon.social
MSc Assignment 2 - Data Analytics Principles
I'm doing an apprenticeship MSc in Digital Technology. In the spirit of openness, I'm blogging my research and my assignments.
This is my paper from the Data Analytics module. I enjoyed it far more than the previous module.
This was my second assignment, and I was amazed to score 72%. In the English system 50% is a pass, 60% is a
https://shkspr.mobi/blog/2021/08/msc-assignment-2-data-analytics-principles/