
Cee · @ceenell
43 followers · 32 posts · Server vis.social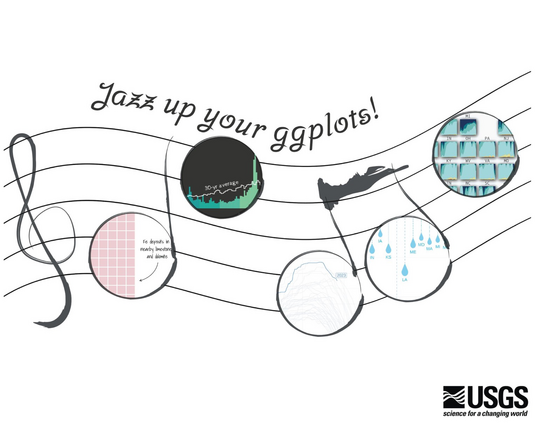
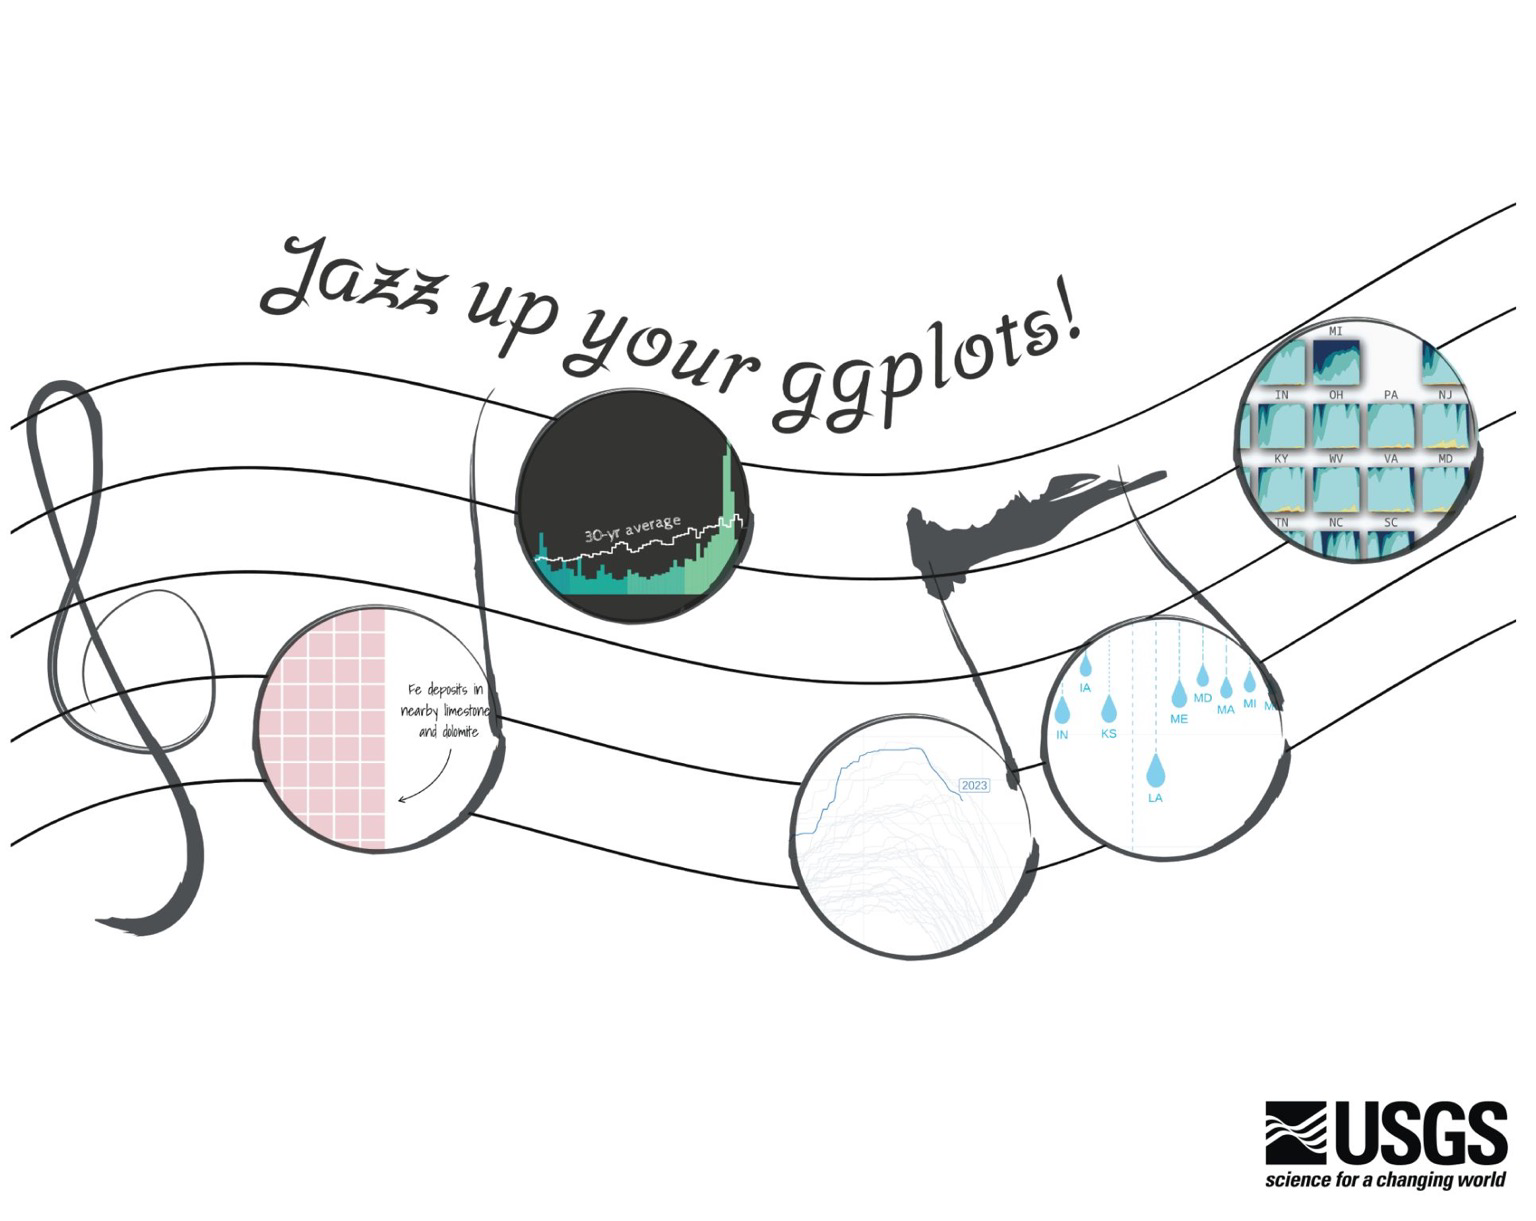
New blog post from #USGSvizlab: jazz up your #ggplot! Showing some of our favorite #dataviz design tricks using #rstats https://waterdata.usgs.gov/blog/ggplot-jazz/
#rstats #dataviz #ggplot #usgsvizlab
Cee · @ceenell
43 followers · 32 posts · Server vis.social
Depending on where you live, #drought may be more common at some times of the year than others. But the timing of droughts, or seasonality, has changed since the 1950s.
#dataviz #rstats #USGSvizlab see more at https://labs.waterdata.usgs.gov/visualizations/what-is-drought/index.html#/
#usgsvizlab #rstats #dataviz #drought