Malte Petersen · @biodatacore
165 followers · 541 posts · Server genomic.socialOne #dataset, 100 #visualisations. An inspiring collection for all you #dataviz-ards:
#dataset #visualisations #dataviz #datascience
Samuel Pavin ☑️ · @Sampavin
220 followers · 171 posts · Server mastodon.auMalmö is building an experience arena with a 360-degree dome screen
The Wisdome will be part theatre, part digital lab, part business centre, and an altogether learning environment.
#Visualisations #Science #Malmö #DigitalLab #Learning #BusinessCentre #Technology
#visualisations #science #malmo #digitallab #learning #businesscentre #technology
EU-OSHA · @EU_OSHA
29 followers · 814 posts · Server respublicae.euFind up-to-date information about the status of #OSH in the 🇪🇺 through our revamped OSH Barometer.
Generate easy-to-understand #visualisations and dashboards with the help of newly introduced #OSHindicators and functionalities.
👉https://osha.europa.eu/en/highlights/new-indicators-and-functionalities-discover-osh-barometer-tool?pk_campaign=sm
#OSHdata #OSHstatistics
🐦🔗: https://n.respublicae.eu/EU_OSHA/status/1605536667061870593
#OSH #visualisations #OSHindicators #OSHdata #OSHstatistics
Luis Suarez · @elsua
132 followers · 44 posts · Server mastodon.socialI feel pretty much like a kid with brand new shiny shoes 😍👍🏻 ... Have you seen any of these? 👇🏻
🤩 - https://instances.social
🤩 - https://fediverse.party/en/portal/servers/
🤩 - https://umap.openstreetmap.fr/fr/map/mastodon-near-me_828094#5/44.972/4.991
🤩 - https://toad.social/@davetroy/109410312138463065
🤩 - https://www.comeetie.fr/galerie/mapstodon/
Gosh, the innovation & the massive potential we're starting to see here in Mastodon sure brings back good old fond memories from back in the day 🐥
Any more favourites out there I may have been missing? 🙏🏻I am *totally* hooked! 😅👍🏻
#visualisations #maps #mapping
Sebastian Raubach · @BazRaubach
48 followers · 24 posts · Server fosstodon.orgSince I've not done an #introduction yet, here goes:
I'm a #bioinformatics research software engineer. I love developing open source software both at work and in my spare time. My work covers areas like #phenotypic data collection, plant genetic resources databases and #visualisations.
My personal projects evolve around #weather data and #photo library software.
Find all my code on GitHub at https://github.com/sebastian-raubach
Feel free to follow me for toots around these topics and random #dog photos 🐕
#introduction #bioinformatics #phenotypic #visualisations #weather #photo #dog
data.europa.eu · @EU_opendata
155 followers · 755 posts · Server respublicae.eu#OpenData
#visualisations
#Europe
@EU_Eurostat 📊📈⛰️🌊🏙️ 👇
RT @EU_Eurostat: Would you like to know more about #EUregions ? Check out the 'Regions in Europe - 2022 interactive edition' here ➡️ https://ec.europa.eu/eurostat/cache/digpub/regions/
#EurostatRYB
🐦🔗: https://nitter.eu/EU_opendata/status/1581193170586857472
#opendata #visualisations #Europe #EURegions #EurostatRYB
Soh Kam Yung · @sohkamyung
556 followers · 11287 posts · Server mstdn.ioTrippy and interesting visualization of what you might see when two black holes with accretion disks orbit each other.
#blackholes #visualisations #apod
Christoph Matthies :verified: · @chrisma
116 followers · 1591 posts · Server mstdn.socialAwesome! 👏 I consider these kind of integrations absolutely essential for smoothing out workflows and increasing collaboration efficiency. Hope to try it out soon!
RT @overleaf@twitter.com
#JupyterCon2020 attendees, we have a special surprise for you but you need to check out our poster on “Building Reproducibility and Efficiency into Document Collaboration Workflows” to find out what it is. :-)
#visualisations #DataScience #AI #Python #JupyterCon2020
Soh Kam Yung · @sohkamyung
556 followers · 11287 posts · Server mstdn.ioInteresting article on how colours can affect how we can interpret scientific data. Article includes examples of the same data visualised using different colours.
https://eos.org/features/visualizing-science-how-color-determines-what-we-see
#data #colour #science #visualisations
Soh Kam Yung · @sohkamyung
556 followers · 11288 posts · Server mstdn.ioInteresting. A new NASA visualisation shows how the gravity of a black hole warps and distorts the accretion disk around itself.
You may have seen a similar view of a black hole in the movie, "Interstellar", but that one is not quite as accurate as there was some 'artistic license' taken.
#Visualisations #Space #BlackHoles #NASA
https://www.nasa.gov/feature/goddard/2019/nasa-visualization-shows-a-black-hole-s-warped-world
#visualisations #space #blackholes #nasa
Soh Kam Yung · @sohkamyung
556 followers · 11288 posts · Server mstdn.ioVery pretty splashes in 3D.
"Beautiful as a splash is, why only enjoy it from a single angle? In this video, the artists behind Macro Room offer a 360-degree perspective on various splashes and fluid collisions. I especially enjoy watching the splash crowns falling back over and out of the various containers they use. What’s your favorite part? (Image and video credit: Macro Room)"
#Physics #FluidDynamics #Videos #Visualisations
https://fyfluiddynamics.com/post/184690739382/beautiful-as-a-splash-is-why-only-enjoy-it-from-a
#physics #fluiddynamics #videos #visualisations
Pierre Huyghebaert · @crickxson
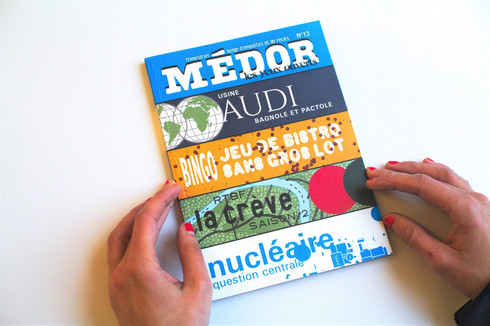
686 followers · 1771 posts · Server post.lurk.orgOn pose sur la table le @Medor_mag n°13 sur lequel Spec a travaillé entre septembre et novembre. Cent trente-deux pages avec l'idée de n'utiliser que de la #cartographie et des #visualisations de données comme éléments visuels pour toutes les #enquêtes du numéro. Et le désir plus global, comme d'autres pilotes visuels avant nous, d'amincir la séparation entre visuels et textes. Où le contenu des enquêtes s'entremêlent avec les formes visuelles qui le détaillent. Tenter de clarifier certaines articulations du texte moins claires quand elles ne sont pas soutenues ou explicitées visuellement. Quelques images à la lumière d'hiver dans une série de posts successifs.
D'abord, la couverture. Celle du Médor n°9 en noir et blanc et texte seul est une tentative qui nous intéresse. En collaboration avec #DEAL et #OSP qui ont mis en page le numéro, et les pilotes journalistes, on a décidé de ramener le nombre de titres au minimum avec cinq bandes de hauteur égale, le motif du disque décliné pour chacun des mondes visuels de chaque enquête.
http://medor.coop
#cartographie #visualisations #enquêtes #deal #osp
Pierre Huyghebaert · @crickxson
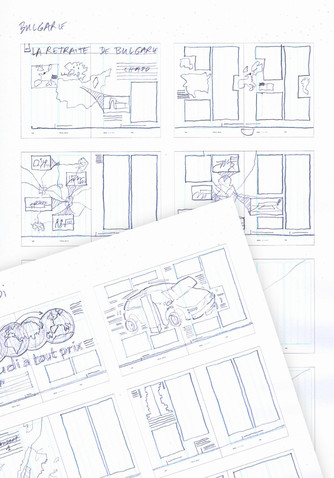
686 followers · 1771 posts · Server post.lurk.org@Medor_mag numéro 13 en préparation avec plein de #visualisations de données et de #cartographie made in Spec!
Plaisir de dessiner.
Avec @boisophieron, @yarela, @Ludi entre autres.


