calculang · @calculang
3 followers · 55 posts · Server fosstodon.orgRetirement fund contour map with @observablehq Plot
https://observablehq.com/@declann/retirement-fund-contour-map?collection=@declann/calculang
LabPlot · @LabPlot
394 followers · 44 posts · Server floss.socialDo you know that you can learn how to easily graph functions with the FREE and open-source LabPlot in less than 5 minutes?
➡️ https://labplot.kde.org/download
👉 Just watch this short video tutorial
👉 Like, Comment, Share and Subscribe
https://www.youtube.com/watch?v=dMmQmExjbU8
#FOSS #FLOSS #OpenSource #FreeSoftware #LibreSoftware #GNU #KDE #Software #Graph #Plot #Math #Function #Visualization #STEM #Education #Tutorial
#FOSS #FLOSS #OpenSource #FreeSoftware #libresoftware #GNU #KDE #software #graph #plot #math #function #visualization #STEM #education #tutorial
Stately · @stately
10 followers · 181 posts · Server social.stately.ai⏮️ Last week we had a great #StatelyOfficeHours where we discussed our upcoming Stately Sky features that use PartyKit 🎈!
Watch our discussion with Sunil, including demos and previews of new features…
https://www.youtube.com/watch?v=_iTjIWq6M1g
#stately #stateMachines #statecharts #diagramming #visualization
#statelyofficehours #stately #statemachines #statecharts #diagramming #visualization
Stately · @stately
10 followers · 180 posts · Server social.stately.ai⏱️ Create a state machine like this in less than 60 seconds!
⬇️ Read David’s latest blog post on how to generate and modify flows from plain text using Stately’s new intelligent features:
https://stately.ai/blog/2023-09-06-generating-flows
#stately #stateMachines #statecharts #diagramming #visualization #generate
#stately #statemachines #statecharts #diagramming #visualization #generate
lqdev · @lqdev
88 followers · 589 posts · Server toot.lqdev.techPerplexity: Interactive LLM visualization #ai #llm #visualization https://www.luisquintanilla.me/feed/perplexity-interactive-llm-visualizations?utm_medium=feed
Nick Byrd · @ByrdNick
927 followers · 568 posts · Server nerdculture.dePeople with relevant experience, potential opinions, and/or followers therewith: @rrrichardzach, @UlrikeHahn, @consequently, @colin, @RanaldClouston, @CubeRootOfTrue, @Inquiry
Relevant topics: #CriticalThinking #edu #higherEd #teaching #learning #research #preregistration #writing #argumentMapping #visualization
#criticalthinking #edu #highered #teaching #learning #research #PreRegistration #writing #argumentmapping #visualization
Stately · @stately
10 followers · 178 posts · Server social.stately.ai🆕 Pro users can now lock machines to prevent accidental edits!
🔒 Lock and unlock from the machine Details panel. Hover over the Locked status in the editor’s top bar to view who locked the machine and when.
Try this and many other new Pro features with a 30 day free trial at https://stately.ai/pricing
#stately #stateMachines #statecharts #diagramming #visualization #pro #StatelyPro
#stately #statemachines #statecharts #diagramming #visualization #pro #statelypro
Peter Stoyko · @peter
223 followers · 237 posts · Server stoyko.spaceHISTORY + VISUALIZATION. A 3D recreation of the Aztec capital of Tenochtitlan. It includes slider comparisons with present day CDMX.
#visualization #urbanism #history #geoviz
LabPlot · @LabPlot
394 followers · 44 posts · Server floss.socialThe #Dracula 🧛♂️ theme for plots is ready for testing in the development versions of #LabPlot.
See more here:
➡️ https://draculatheme.com/labplot
➡️ https://github.com/dracula/labplot
Download here:
➡️ https://labplot.kde.org/download
#DataViz #Visualization #Plotting #Color #LabPlot #FreeSoftware #FOSS #OpenSource #FLOSS #Plot
#dracula #labplot #dataViz #visualization #plotting #color #FreeSoftware #FOSS #OpenSource #FLOSS #plot
calculang · @calculang
3 followers · 54 posts · Server fosstodon.orgcalcuvizspec is an alpha visualization API for calculang models.
Some recent slides demo how interactive examples work (explore Code blocks).
https://calcuvizspec-presentation.pages.dev/calcuvizspec-revealjs
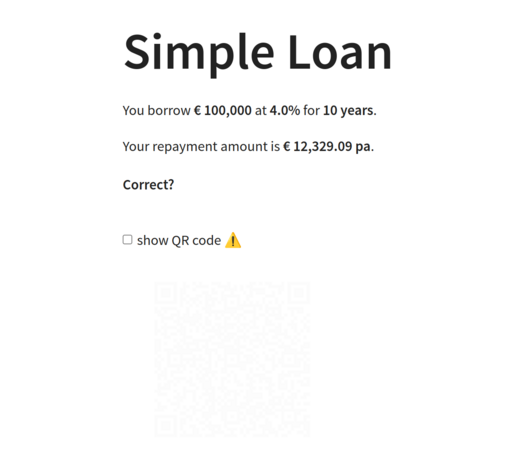
They also feature a sneaky question slide and a maybe-approach(?) hidden in a QR code. ▌║█║▌│║▌
#calculang #visualization #transparency #numbers
Stately · @stately
10 followers · 177 posts · Server social.stately.aiNew ✨ experimental ✨ feature for Pro users:
🤖 Generate flows! You can now auto-create or modify machines from text descriptions.
Find the Generate flow button in the editor’s top bar. Sign up to our free trial to try all our Pro features for 30 days!
#stately #stateMachines #statecharts #diagramming #visualization #autogenerate #prompt
#stately #statemachines #statecharts #diagramming #visualization #autogenerate #prompt
Stately · @stately
10 followers · 177 posts · Server social.stately.ai🚨 Join us live in 30 minutes for an extra special office hours!
🎉 We’ll be joined by Sunil of PartyKit to demo some of our most exciting features yet…
Live streaming on YouTube at:
https://www.youtube.com/watch?v=_iTjIWq6M1g
#StatelyOfficeHours #partyKit #stateMachines #statecharts #live #visualization #collaboration
#statelyofficehours #partykit #statemachines #statecharts #live #visualization #collaboration
Dave Mackey · @davidshq
991 followers · 1890 posts · Server hachyderm.iosecond #question of the day: 😂
for web-based #geospatial #medical #visualization, e.g., like #slideimages - what do you use / #recommend
#recommendations #health #coding #javascript #web #WebDevelopment
#question #geospatial #medical #visualization #slideimages #recommend #recommendations #health #coding #javascript #web #webdevelopment
OpenSociocracy · @opensociocracy
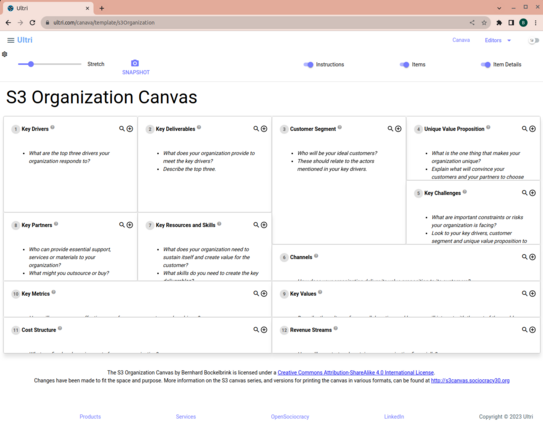
26 followers · 22 posts · Server fosstodon.orgThe Sociocracy 3.0 Canvases are included in Ultri's Canava now.
https://www.ultri.com/canava
That allows easy customization of the canvas rows, columns, and instructions. It also makes viewing and entering the data easier than other canvases.
Give them a try and tell us what you think.
https://www.ultri.com/canava/template/s3Organization
https://www.ultri.com/canava/template/s3Team
https://www.ultri.com/canava/template/s3Delegation
#sociocracy #business #planning #canvas #coop #team #organization #domain #Visualization #diagram #chart
#sociocracy #business #planning #canvas #coop #team #organization #domain #visualization #diagram #chart
GregCocks · @GregCocks
609 followers · 553 posts · Server techhub.socialA New, Underground Atlas Of Subduction Zones [EOS]
--
https://eos.org/articles/a-new-underground-atlas-of-subduction-zones <-- shared technical article
--
https://submap.gm.umontpellier.fr/ <-- Submap, a tool for mapping subduction zones
--
“Graphic design meets geoscience…
Submap is a user-friendly tool that allows anyone with an Internet connection to create quick, custom maps of subduction zones…"
#GIS #spatial #mapping #visual #visualisation #visualization #subduction #geology #structuralgeology #Submap #geoscience #global #earth #platetectonics #subductionzones #earthquake #model #modeling #3dmapping #3dmodeling #opensource #opendata #tsunami #monitoring #fault #faulting #VisualizationTools #maps #crosssections
#gis #spatial #mapping #visual #visualisation #visualization #subduction #geology #structuralgeology #submap #geoscience #global #earth #platetectonics #subductionzones #earthquake #model #modeling #3dmapping #3dmodeling #opensource #opendata #tsunami #monitoring #fault #faulting #visualizationtools #Maps #crosssections
Web Axe · @WebAxe
932 followers · 777 posts · Server a11y.infoAn Accessibility-First Approach To Chart Visual Design https://www.smashingmagazine.com/2022/07/accessibility-first-approach-chart-visual-design/ #charts #a11y #UIDesign #visualization
#charts #a11y #uidesign #visualization
Steven P. Sanderson II, MPH · @stevensanderson
162 followers · 764 posts · Server mstdn.social📢 Exciting news! Learn to visualize categorical data in R with these engaging charts:
1️⃣ Barplots with ggplot2's geom_bar()
2️⃣ Grouped boxplots with base R and ggplot2
3️⃣ Mosaic plots
🔍 Check out the guide here: https://www.spsanderson.com/steveondata/posts/2023-08-29/
🔬 Experiment with your own data and uncover valuable insights!
#ggplot2 #visualization #r #RStats #datavisualization
Steven P. Sanderson II, MPH · @stevensanderson
162 followers · 761 posts · Server mstdn.socialVertical lines in your histograms? Yes please:
#R #RStats #histograms #visualization
Post: https://www.spsanderson.com/steveondata/posts/2023-08-28/
#visualization #histograms #RStats #r
LabPlot · @LabPlot
394 followers · 44 posts · Server floss.socialIf you are interested, please see also this thread on the importance of visualizing data (the Anscombe's quartet, Simpson's paradox are also included in @LabPlot):
https://mstdn.social/@onemoment/109692198312380103
#Anscombe #SimpsonsParadox #DatasaurusDozen #Visualization #DataViz
#anscombe #simpsonsparadox #datasaurusdozen #visualization #dataViz
LabPlot · @LabPlot
394 followers · 44 posts · Server floss.socialIs there a causal relationship between electricity consumption and obesity, or is it just an illusory correlation❓
@science @dataisbeautiful @health
The plot and curve fitting made in @LabPlot, a FREE, open source Data Visualization and Analysis software. It works on #Windows, #Linux and #macOS.
➡️ https://labplot.kde.org/download
#Data compiled for 184 countries.
#FOSS #FLOSS #OpenSource #FreeSoftware #DataViz #Visualization #Obesity #Health #ClimateChange #ClimateCrisis #Climate #Food
#Windows #Linux #macOS #data #FOSS #FLOSS #OpenSource #FreeSoftware #dataViz #visualization #obesity #health #ClimateChange #ClimateCrisis #climate #food


